Thursday, November 12, 2026 · After Close
Explosive Up Setups13
 click to enlarge
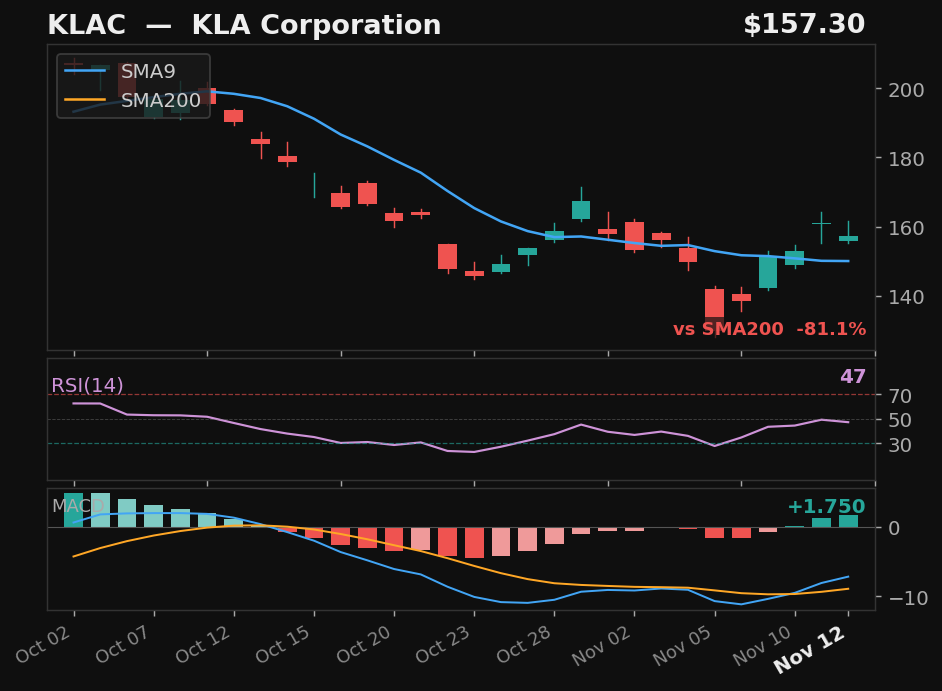
KLAC
KLA Corporation
NASDAQ
- 16.9% pullback — 4 days below SMA9
- Prior rally: 20% — strong trend to recover into
- MACD momentum building
ExplosiveUp
Exp Score80Days Below4Pullback%16.9
Returns
StockMktDiff
1D-3.2%-0.4%-2.8%
2D-8.5%-2.3%-6.2%
3D-8.1%-3.3%-4.8%
5D-10.1%-5.4%-4.6%
10D———
 click to enlarge
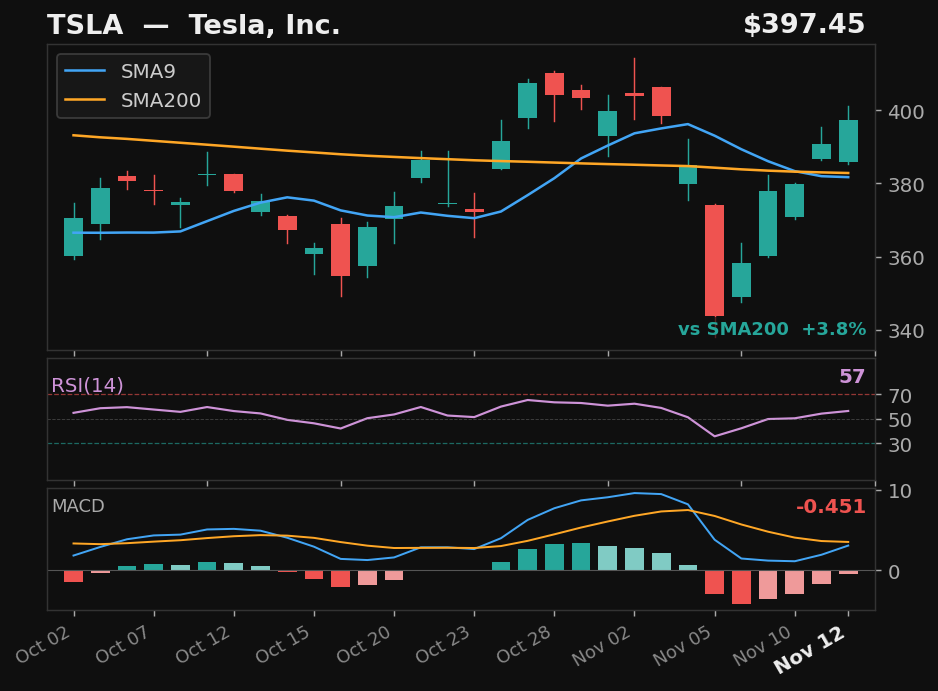
TSLA
Tesla, Inc.
NASDAQ
- 13.8% pullback — 5 days below SMA9
- Prior rally: 16%
- Above SMA200 (4%)
- MACD histogram rising from negative — early momentum signal
ExplosiveUp
Exp Score80Days Below5Pullback%13.8
Returns
StockMktDiff
1D-1.8%-0.4%-1.5%
2D-4.5%-2.3%-2.2%
3D-4.4%-3.3%-1.1%
5D-5.8%-5.4%-0.3%
10D———
 click to enlarge
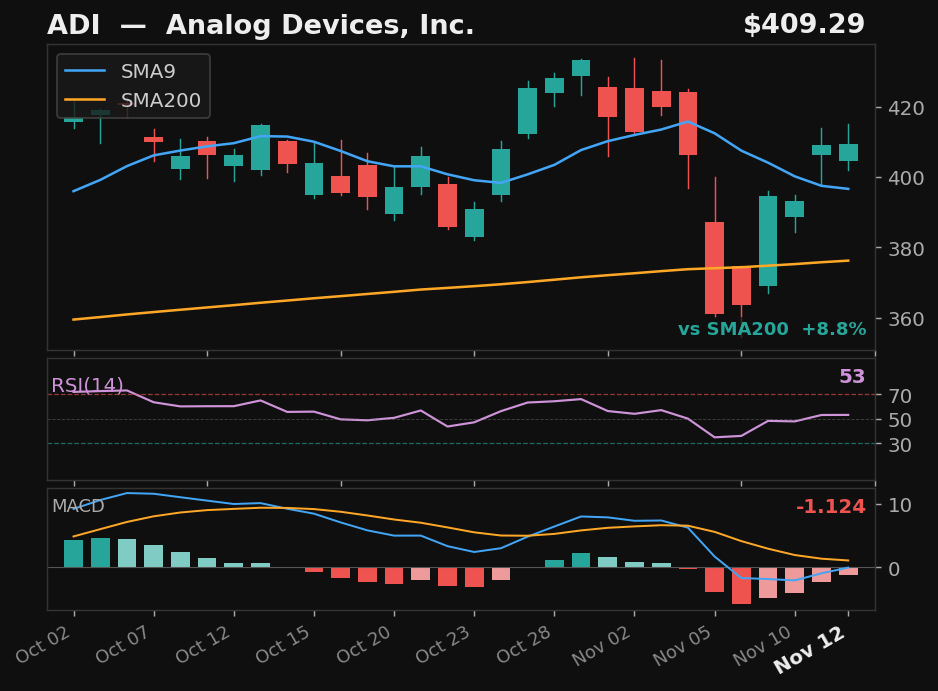
ADI
Analog Devices, Inc.
NASDAQ
- 14.0% pullback — 5 days below SMA9
- Prior rally: 16%
- Above SMA200 (9%)
- MACD histogram rising from negative — early momentum signal
ExplosiveUp
Exp Score75Days Below5Pullback%14.0
Returns
StockMktDiff
1D-2.8%-0.4%-2.4%
2D-6.4%-2.3%-4.1%
3D-6.3%-3.3%-3.0%
5D-7.8%-5.4%-2.3%
10D———
 click to enlarge
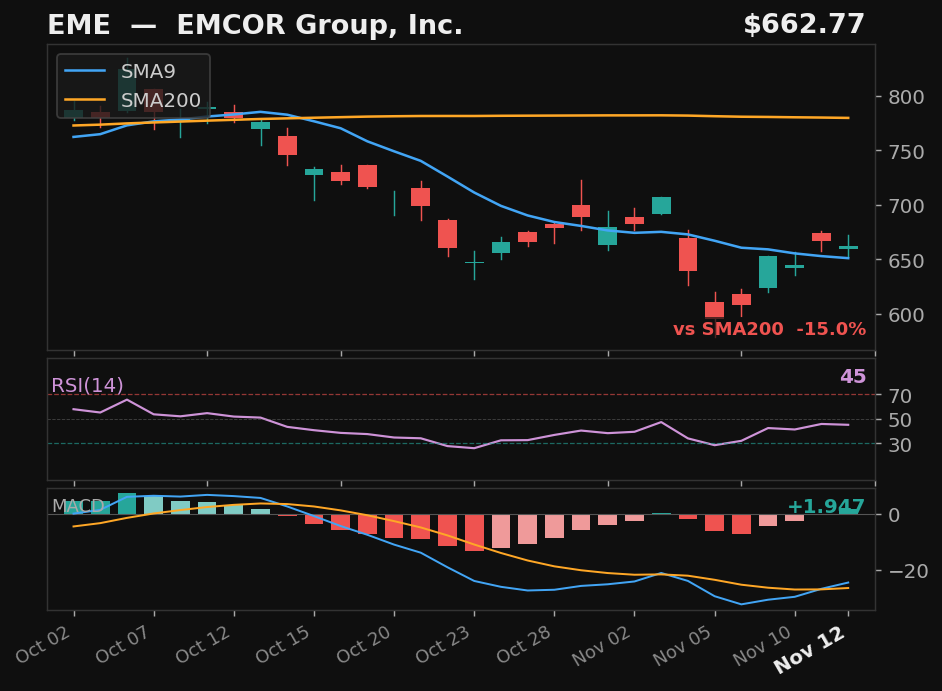
EME
EMCOR Group, Inc.
NYSE
- 15.8% pullback — 5 days below SMA9
- Prior rally: 19%
- MACD momentum building
ExplosiveUp
Exp Score67Days Below5Pullback%15.8
Returns
StockMktDiff
1D-0.5%-0.4%-0.2%
2D-3.6%-2.3%-1.4%
3D-2.5%-3.3%+0.8%
5D-4.0%-5.4%+1.4%
10D———
 click to enlarge
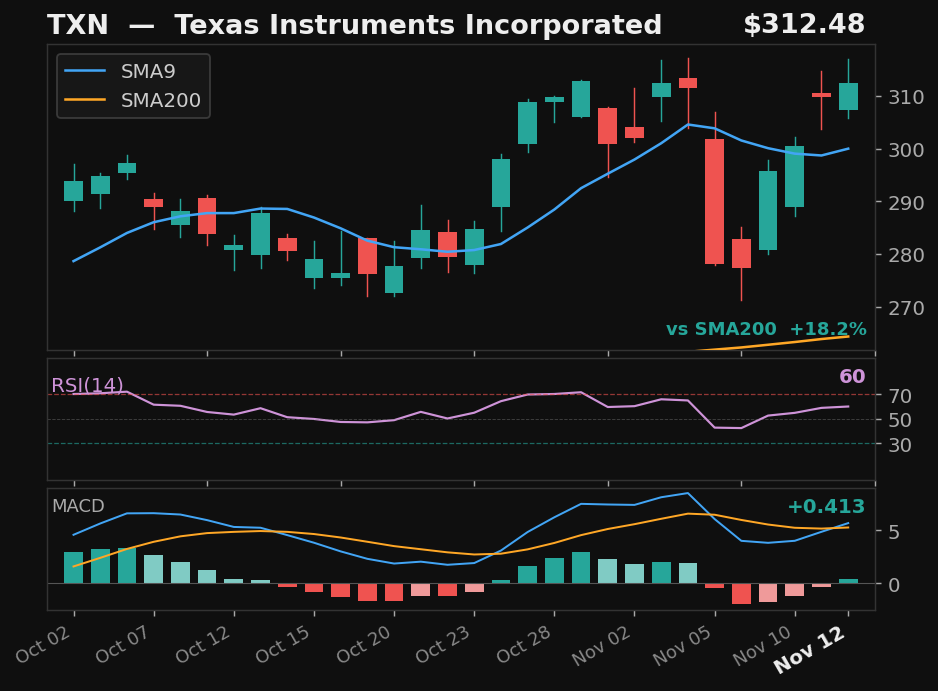
TXN
Texas Instruments Incorporated
NASDAQ
- 11.0% pullback — 3 days below SMA9
- Prior rally: 12%
- Above SMA200 (18%)
- MACD momentum building
ExplosiveUp
Exp Score58Days Below3Pullback%11.0
Returns
StockMktDiff
1D-2.8%-0.4%-2.5%
2D-5.8%-2.3%-3.6%
3D-5.3%-3.3%-2.1%
5D-8.6%-5.4%-3.1%
10D———
 click to enlarge
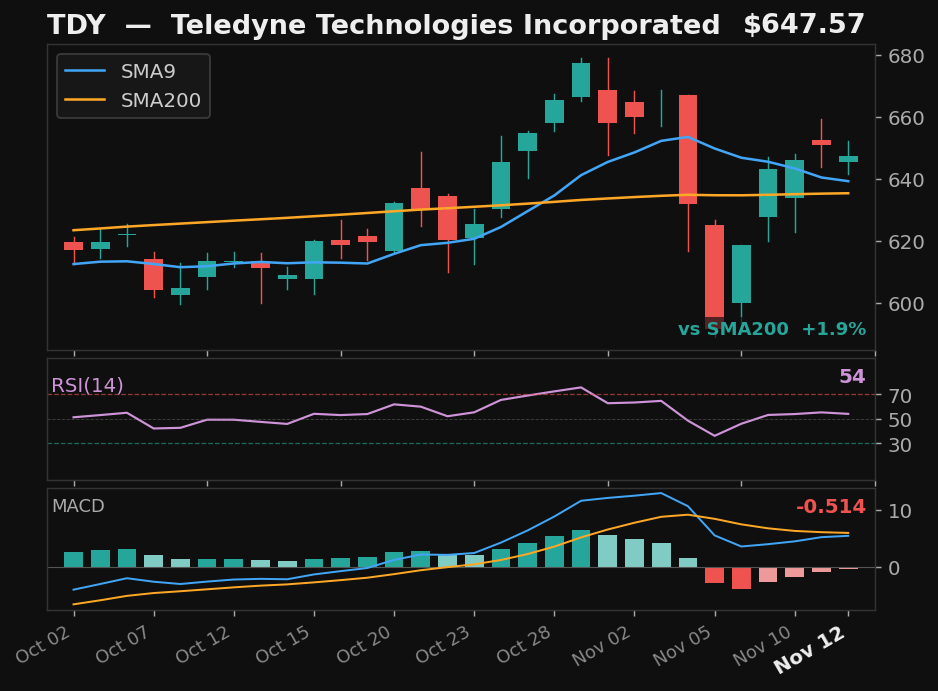
TDY
Teledyne Technologies Incorporated
NYSE
- 10.8% pullback — 4 days below SMA9
- Prior rally: 12%
- Above SMA200 (2%)
- MACD histogram rising from negative — early momentum signal
ExplosiveUp
Exp Score57Days Below4Pullback%10.8
Returns
StockMktDiff
1D-0.6%-0.4%-0.2%
2D-3.0%-2.3%-0.8%
3D-4.4%-3.3%-1.1%
5D-4.0%-5.4%+1.5%
10D———
 click to enlarge
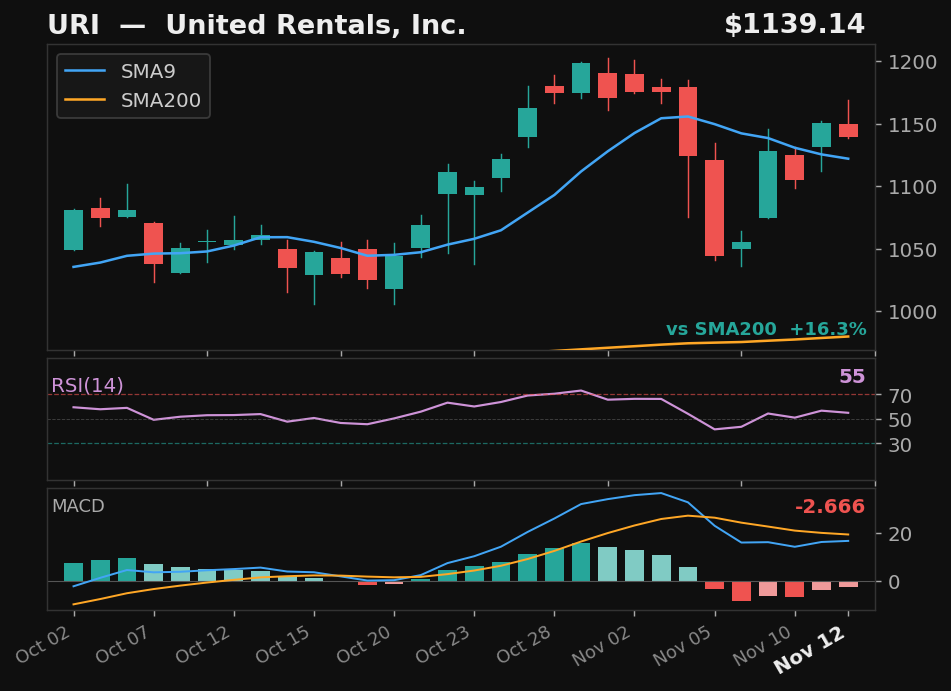
URI
United Rentals, Inc.
NYSE
- 11.2% pullback — 5 days below SMA9
- Prior rally: 13%
- Above SMA200 (16%)
- MACD histogram rising from negative — early momentum signal
ExplosiveUp
Exp Score55Days Below5Pullback%11.2
Returns
StockMktDiff
1D-1.3%-0.4%-0.9%
2D-3.9%-2.3%-1.6%
3D-5.0%-3.3%-1.7%
5D-7.0%-5.4%-1.5%
10D———
 click to enlarge
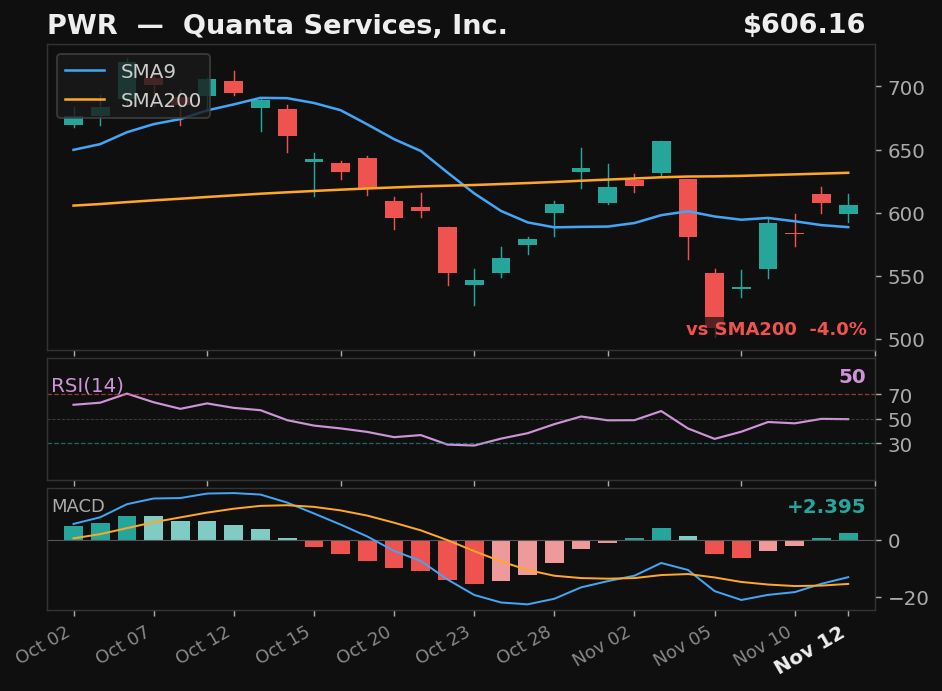
PWR
Quanta Services, Inc.
NYSE
- 22.5% pullback — 5 days below SMA9
- Prior rally: 29% — strong trend to recover into
- MACD momentum building
ExplosiveUp
Exp Score54Days Below5Pullback%22.5
Returns
StockMktDiff
1D-0.7%-0.4%-0.3%
2D-3.3%-2.3%-1.1%
3D-1.3%-3.3%+2.0%
5D-3.1%-5.4%+2.4%
10D———
 click to enlarge
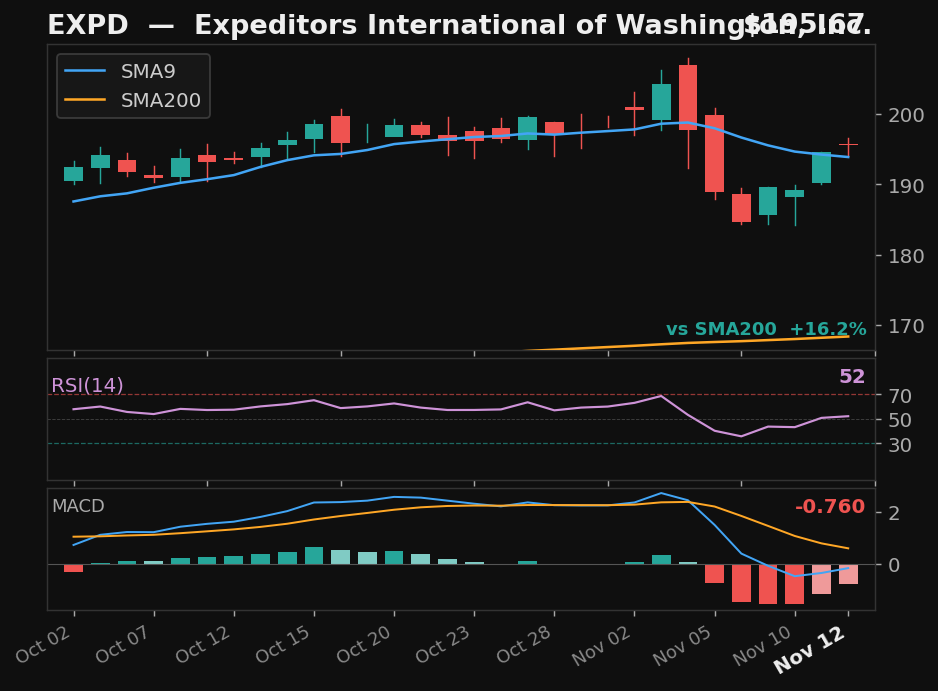
EXPD
Expeditors International of Washington, Inc.
NYSE
- 9.6% pullback — 5 days below SMA9
- Prior rally: 11%
- Above SMA200 (16%)
- MACD histogram rising from negative — early momentum signal
ExplosiveUp
Exp Score52Days Below5Pullback%9.6
Returns
StockMktDiff
1D-0.4%-0.4%-0.1%
2D-0.2%-2.3%+2.1%
3D-2.5%-3.3%+0.8%
5D-1.3%-5.4%+4.2%
10D———
 click to enlarge
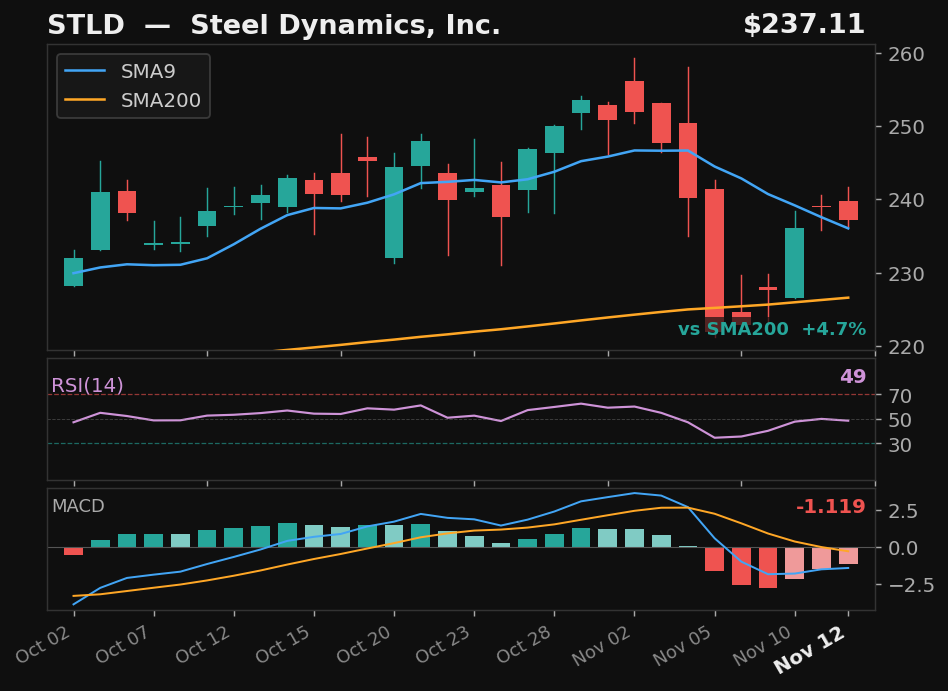
STLD
Steel Dynamics, Inc.
NASDAQ
- 10.4% pullback — 5 days below SMA9
- Prior rally: 12%
- Above SMA200 (5%)
- MACD histogram rising from negative — early momentum signal
ExplosiveUp
Exp Score52Days Below5Pullback%10.4
Returns
StockMktDiff
1D-3.2%-0.4%-2.9%
2D-4.8%-2.3%-2.6%
3D-5.3%-3.3%-2.0%
5D-7.9%-5.4%-2.5%
10D———
 click to enlarge
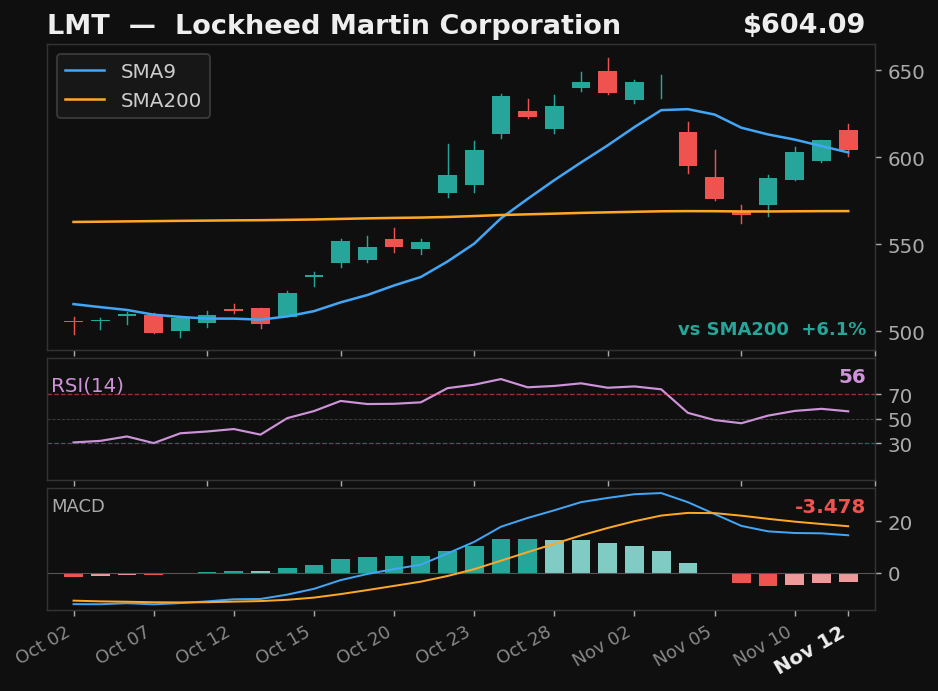
LMT
Lockheed Martin Corporation
NYSE
- 11.3% pullback — 5 days below SMA9
- Prior rally: 13%
- Above SMA200 (6%)
- MACD histogram rising from negative — early momentum signal
ExplosiveUp
Exp Score52Days Below5Pullback%11.3
Returns
StockMktDiff
1D-1.3%-0.4%-1.0%
2D-3.1%-2.3%-0.9%
3D-2.3%-3.3%+1.0%
5D-5.3%-5.4%+0.1%
10D———
 click to enlarge
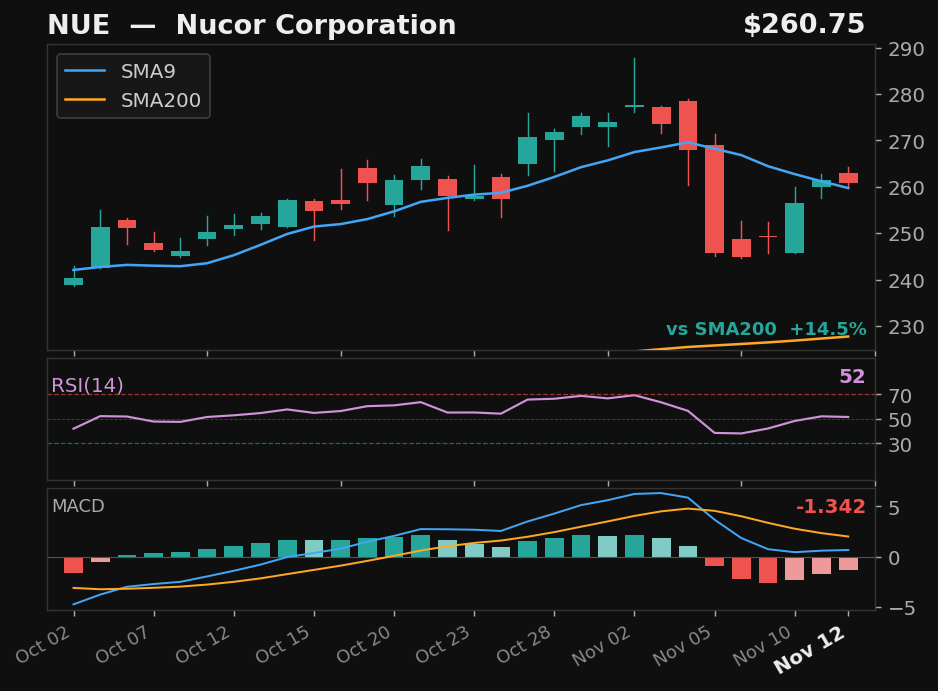
NUE
Nucor Corporation
NYSE
- 10.4% pullback — 5 days below SMA9
- Prior rally: 12%
- Above SMA200 (14%)
- MACD histogram rising from negative — early momentum signal
ExplosiveUp
Exp Score52Days Below5Pullback%10.4
Returns
StockMktDiff
1D-3.5%-0.4%-3.1%
2D-3.1%-2.3%-0.8%
3D-3.3%-3.3%-0.1%
5D-5.1%-5.4%+0.3%
10D———
 click to enlarge
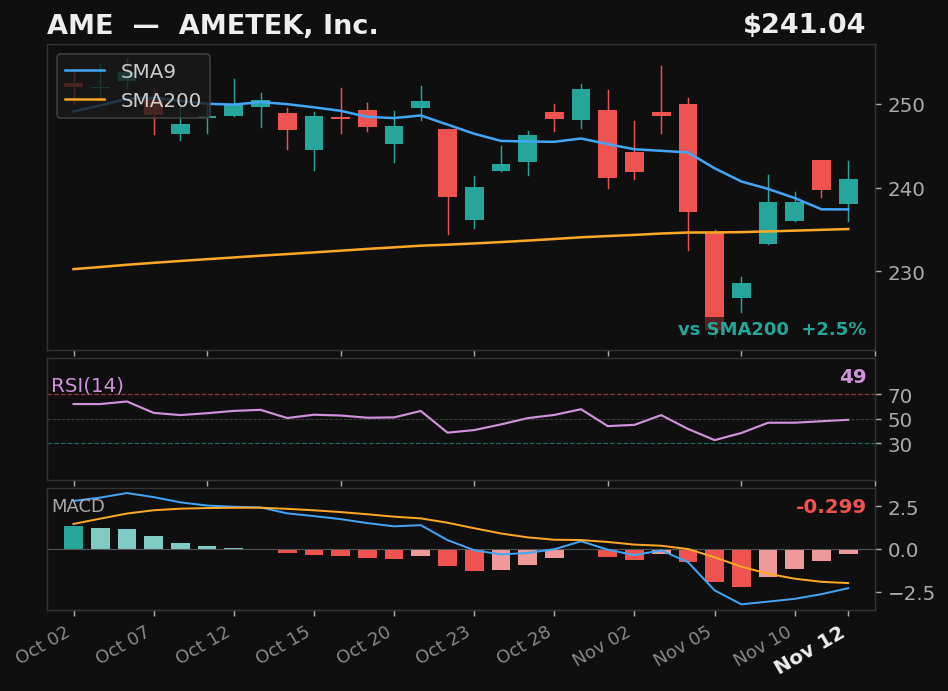
AME
AMETEK, Inc.
NYSE
- 10.3% pullback — 5 days below SMA9
- Prior rally: 11%
- Above SMA200 (3%)
- MACD histogram rising from negative — early momentum signal
ExplosiveUp
Exp Score49Days Below5Pullback%10.3
Returns
StockMktDiff
1D+0.4%-0.4%+0.8%
2D-2.2%-2.3%+0.1%
3D-2.6%-3.3%+0.7%
5D-4.1%-5.4%+1.3%
10D———
Empirical4
 click to enlarge
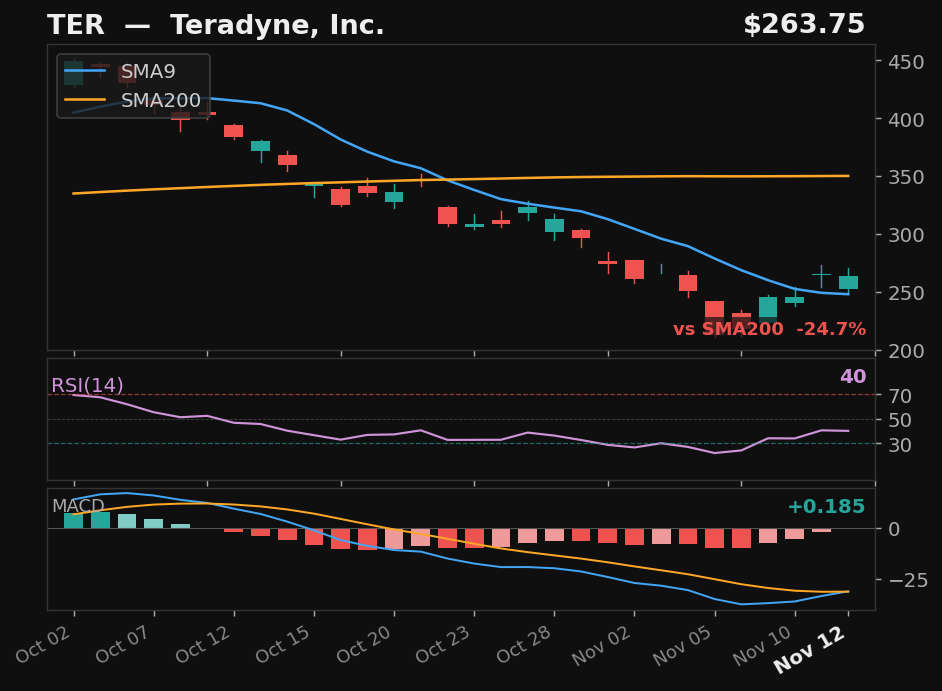
TER
Teradyne, Inc.
NASDAQ
- 50.6% pullback — full candle body above SMA9
- MACD histogram rising while still negative — early recovery signal
- 24.7% below SMA200 — extended from trend
Empirical
Emp Score111.5Body Above✓
Returns
StockMktDiff
1D-5.4%-0.4%-5.0%
2D-12.1%-2.3%-9.8%
3D-11.2%-3.3%-8.0%
5D-13.8%-5.4%-8.3%
10D———
 click to enlarge
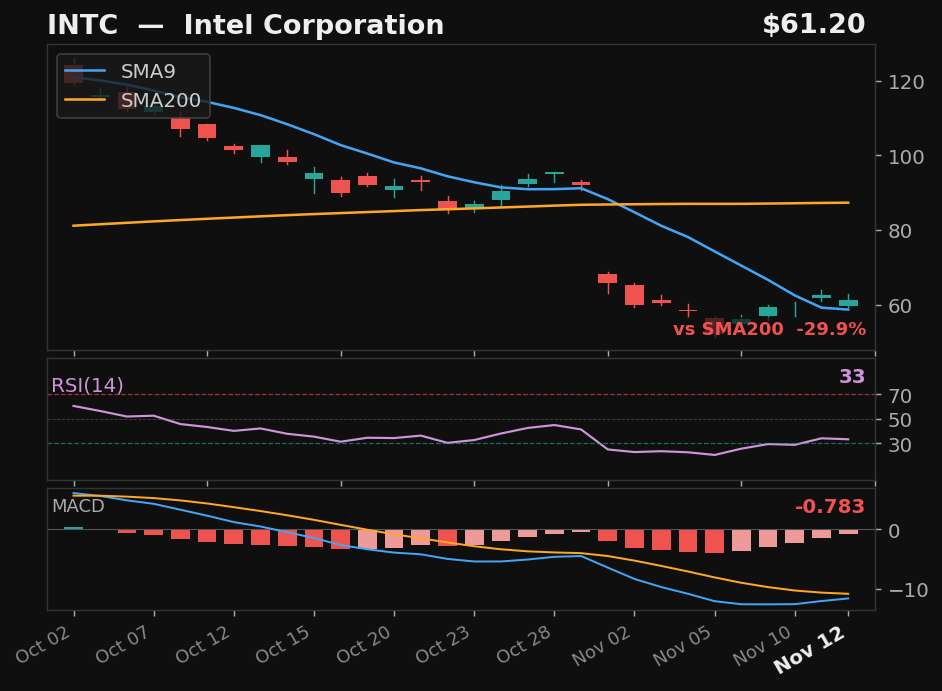
INTC
Intel Corporation
NASDAQ
- 43.2% pullback — full candle body above SMA9
- MACD histogram rising while still negative — early recovery signal
- 29.9% below SMA200 — extended from trend
Empirical
Emp Score98.5Body Above✓
Returns
StockMktDiff
1D-2.5%-0.4%-2.2%
2D-9.4%-2.3%-7.1%
3D-9.9%-3.3%-6.6%
5D-9.0%-5.4%-3.5%
10D———
 click to enlarge
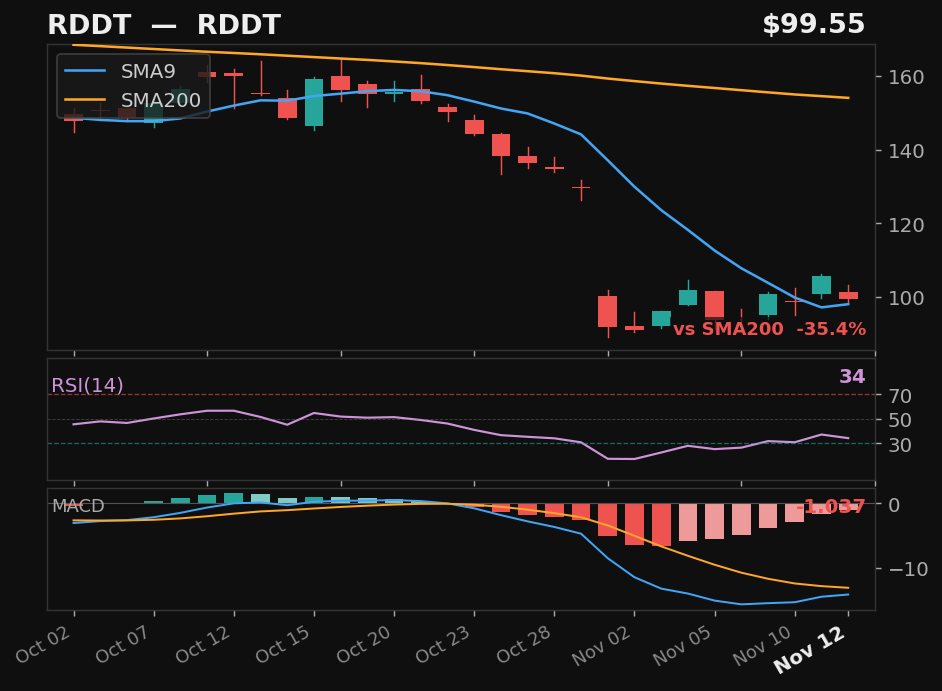
RDDT
RDDT
NYSE
- 41.7% pullback — full candle body above SMA9
- MACD histogram rising while still negative — early recovery signal
- 35.4% below SMA200 — extended from trend
Empirical
Emp Score97.1Body Above✓
Returns
StockMktDiff
1D-1.1%-0.4%-0.7%
2D-6.7%-2.3%-4.4%
3D-5.1%-3.3%-1.8%
5D-9.7%-5.4%-4.3%
10D———
 click to enlarge
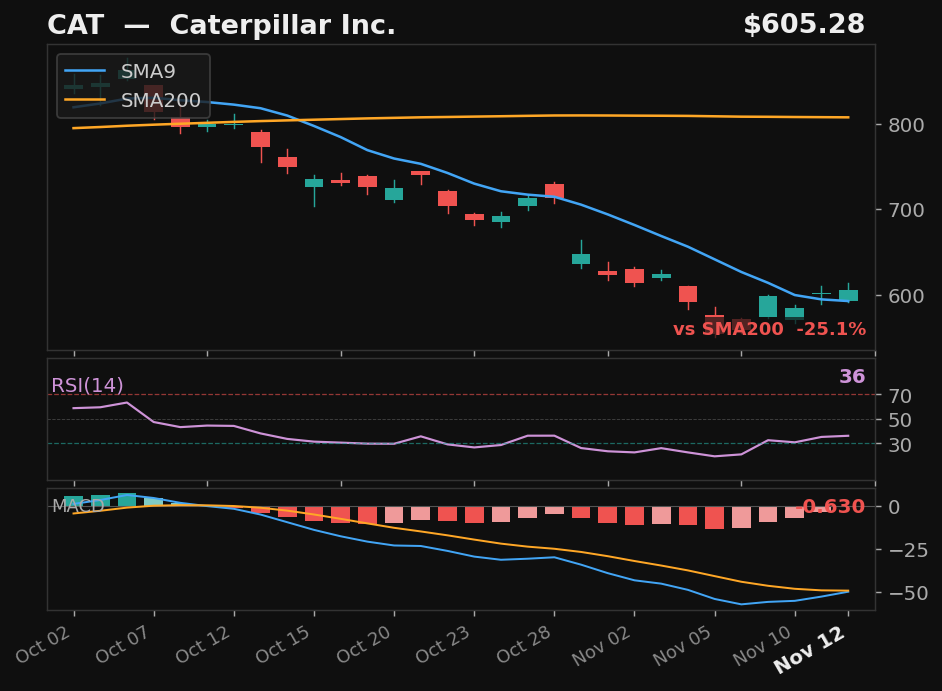
CAT
Caterpillar Inc.
NYSE
- 35.9% pullback — full candle body above SMA9
- RSI rising from 37
- MACD histogram rising while still negative — early recovery signal
- 25.1% below SMA200 — extended from trend
Empirical
Emp Score82.3Body Above✓
Returns
StockMktDiff
1D-0.8%-0.4%-0.5%
2D-5.7%-2.3%-3.5%
3D-5.7%-3.3%-2.4%
5D-11.2%-5.4%-5.8%
10D———