Wednesday, November 11, 2026 · After Close
Explosive Up Setups19
 click to enlarge
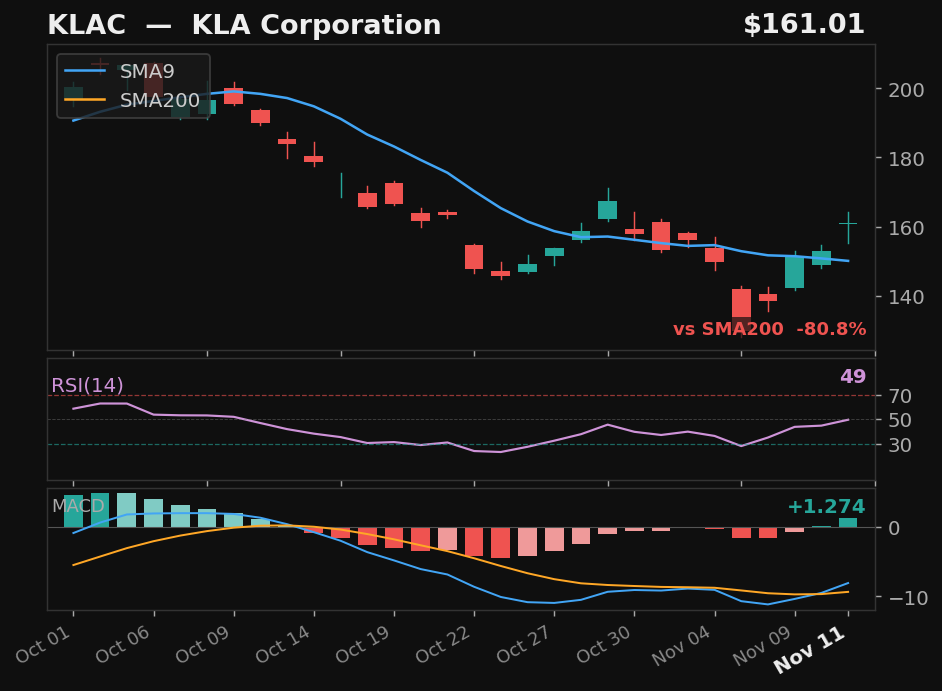
KLAC
KLA Corporation
NASDAQ
- 16.9% pullback — 4 days below SMA9
- Prior rally: 20% — strong trend to recover into
- MACD momentum building
ExplosiveUp
Exp Score80Days Below4Pullback%16.9
Returns
StockMktDiff
1D-2.3%-0.4%-2.0%
2D-5.4%-0.7%-4.7%
3D-10.6%-2.6%-8.0%
5D-10.0%-3.9%-6.1%
10D———
 click to enlarge
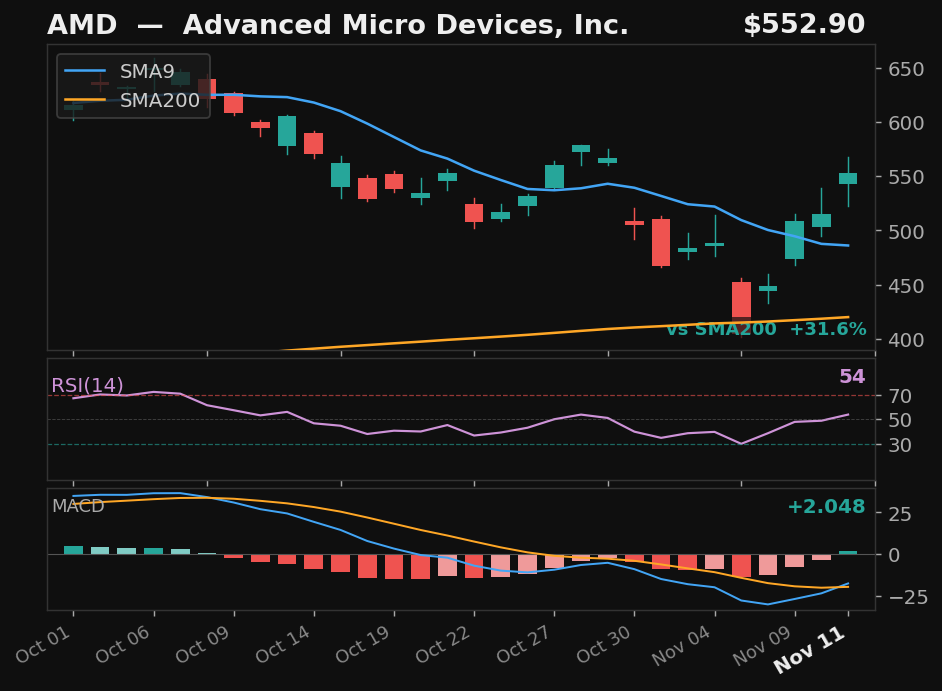
AMD
Advanced Micro Devices, Inc.
NASDAQ
- 28.6% pullback — 6 days below SMA9
- Prior rally: 40% — strong trend to recover into
- 32% above SMA200 — strong structural position
- MACD momentum building
ExplosiveUp
Exp Score79Days Below6Pullback%28.6
Returns
StockMktDiff
1D+5.9%-0.4%+6.2%
2D-3.4%-0.7%-2.7%
3D-8.8%-2.6%-6.2%
5D-4.1%-3.9%-0.2%
10D———
 click to enlarge
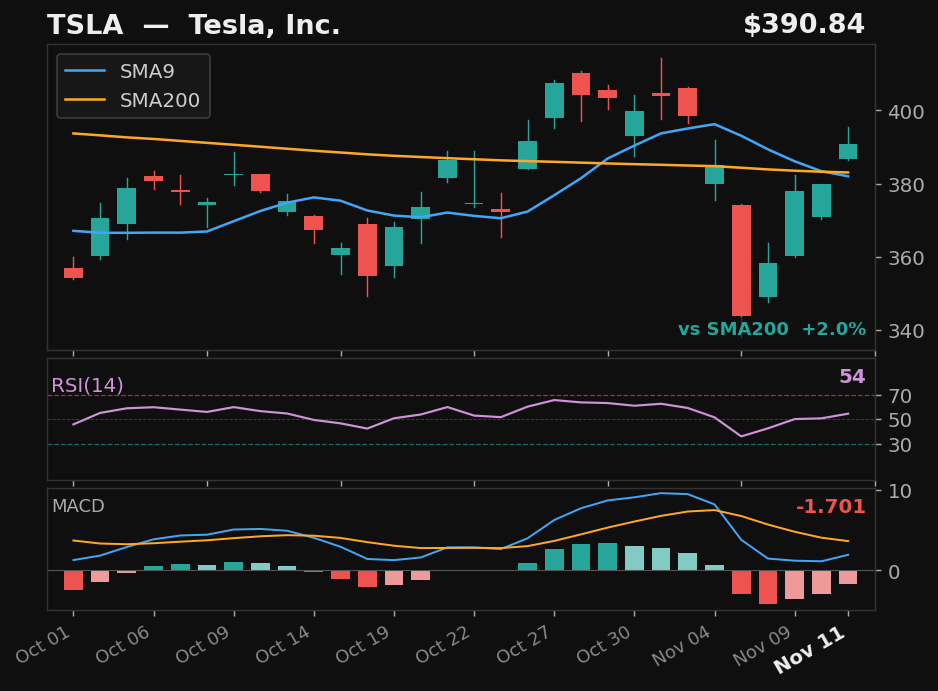
TSLA
Tesla, Inc.
NASDAQ
- 13.8% pullback — 5 days below SMA9
- Prior rally: 16%
- Above SMA200 (2%)
- MACD histogram rising from negative — early momentum signal
ExplosiveUp
Exp Score77Days Below5Pullback%13.8
Returns
StockMktDiff
1D+1.7%-0.4%+2.0%
2D-0.2%-0.7%+0.6%
3D-2.8%-2.6%-0.2%
5D-1.8%-3.9%+2.1%
10D———
 click to enlarge
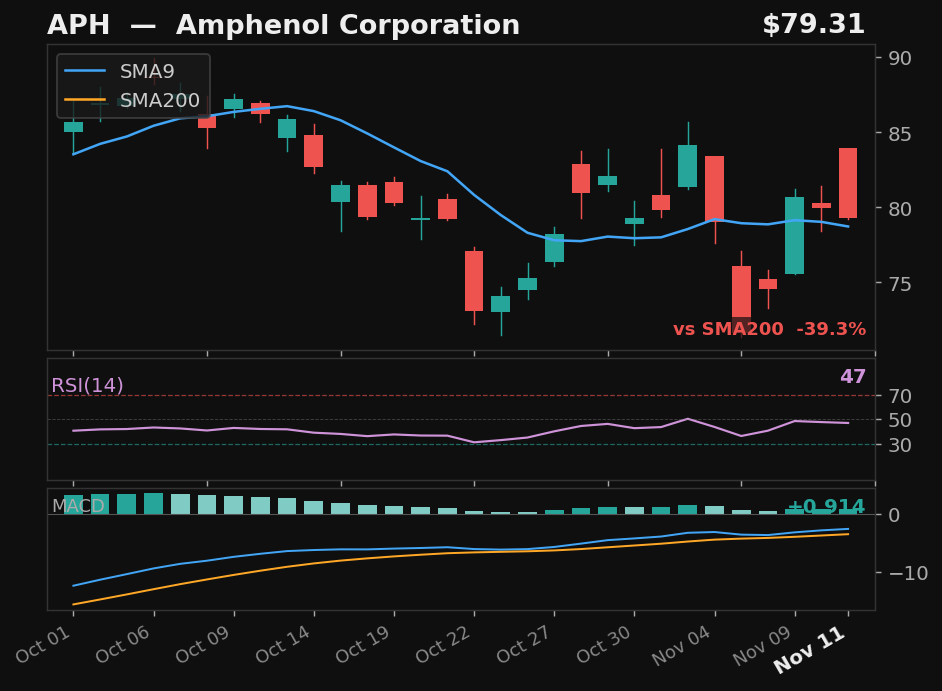
APH
Amphenol Corporation
NYSE
- 14.9% pullback — 3 days below SMA9
- Prior rally: 18%
- Above SMA200 (5%)
- MACD momentum building
ExplosiveUp
Exp Score75Days Below3Pullback%14.9
Returns
StockMktDiff
1D+0.4%-0.4%+0.7%
2D-1.4%-0.7%-0.6%
3D-4.9%-2.6%-2.3%
5D-3.8%-3.9%+0.1%
10D———
 click to enlarge
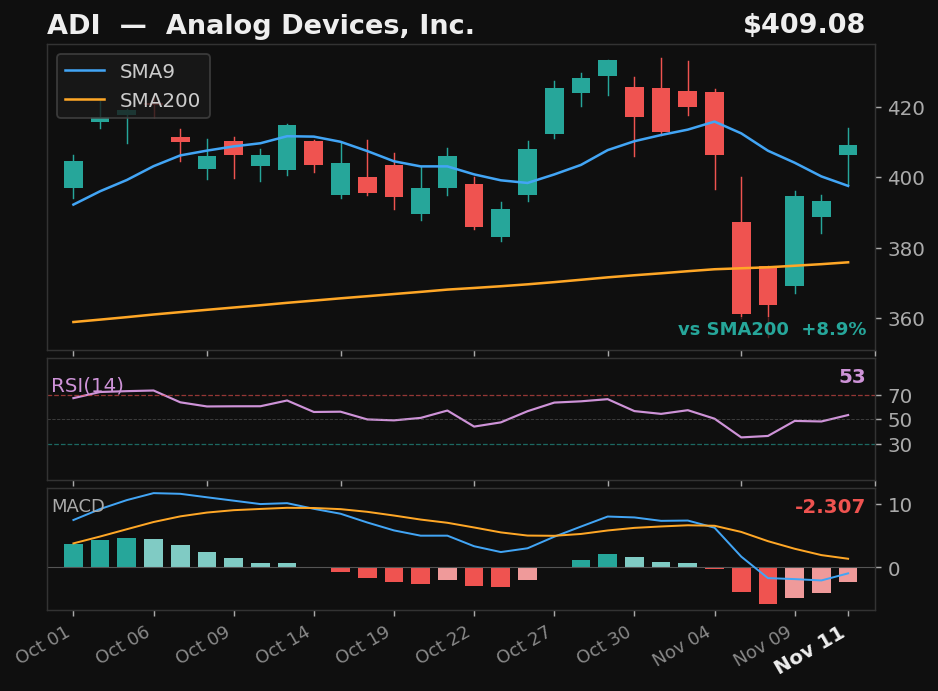
ADI
Analog Devices, Inc.
NASDAQ
- 14.0% pullback — 5 days below SMA9
- Prior rally: 16%
- Above SMA200 (9%)
- MACD histogram rising from negative — early momentum signal
ExplosiveUp
Exp Score75Days Below5Pullback%14.0
Returns
StockMktDiff
1D+0.1%-0.4%+0.4%
2D-2.7%-0.7%-2.0%
3D-6.3%-2.6%-3.7%
5D-6.6%-3.9%-2.7%
10D———
 click to enlarge
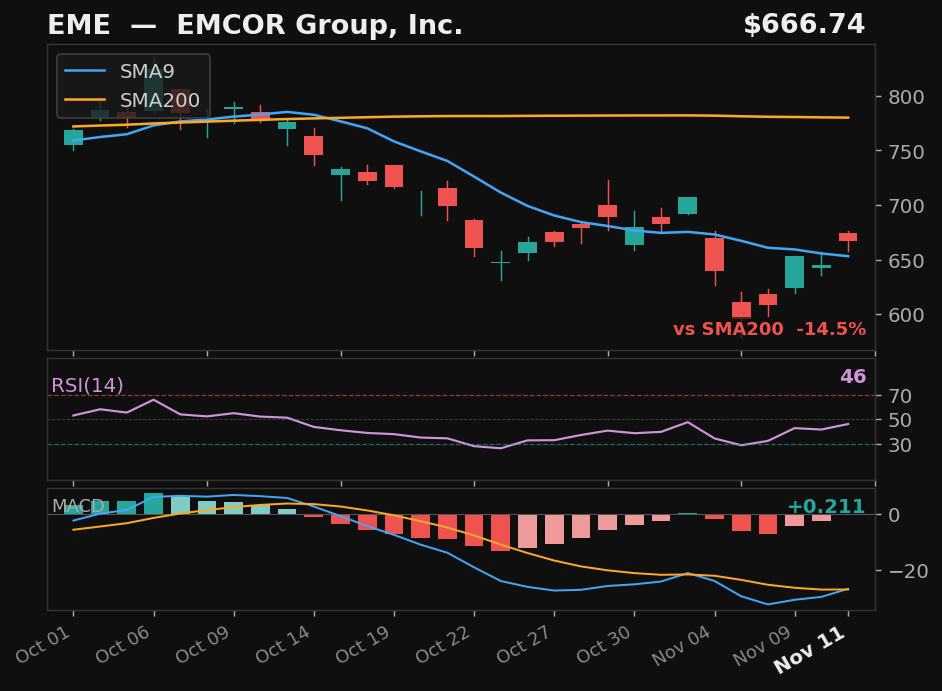
EME
EMCOR Group, Inc.
NYSE
- 15.8% pullback — 5 days below SMA9
- Prior rally: 19%
- MACD histogram rising from negative — early momentum signal
ExplosiveUp
Exp Score72Days Below5Pullback%15.8
Returns
StockMktDiff
1D-0.6%-0.4%-0.2%
2D-1.1%-0.7%-0.4%
3D-4.2%-2.6%-1.6%
5D-3.1%-3.9%+0.8%
10D———
 click to enlarge
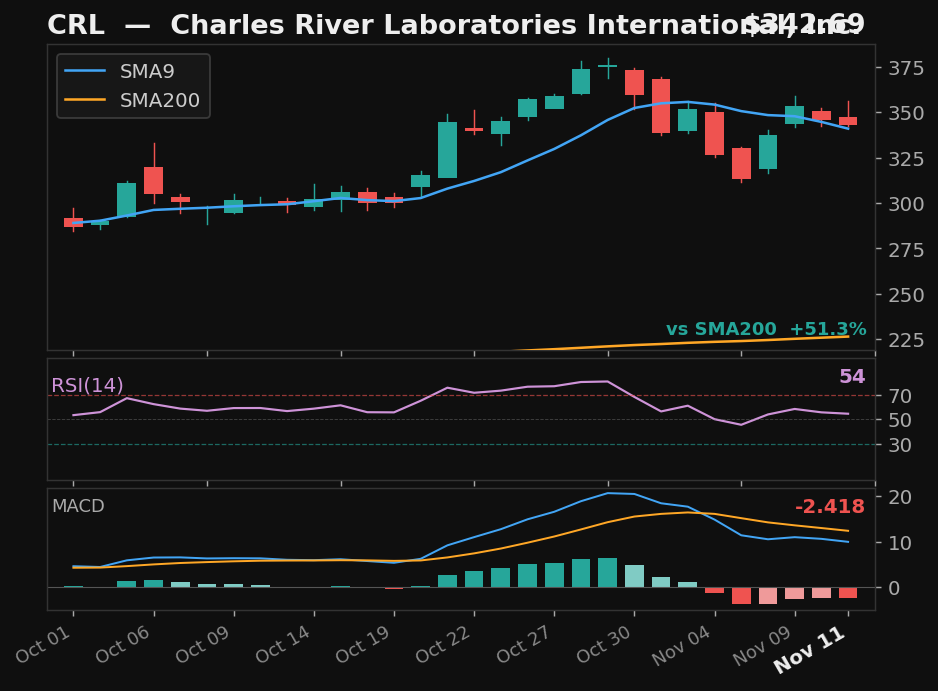
CRL
Charles River Laboratories International, Inc.
NYSE
- 12.9% pullback — 5 days below SMA9
- Prior rally: 15%
- 51% above SMA200 — strong structural position
ExplosiveUp
Exp Score72Days Below5Pullback%12.9
Returns
StockMktDiff
1D-0.5%-0.4%-0.2%
2D-1.4%-0.7%-0.7%
3D-2.1%-2.6%+0.5%
5D-2.8%-3.9%+1.1%
10D———
 click to enlarge
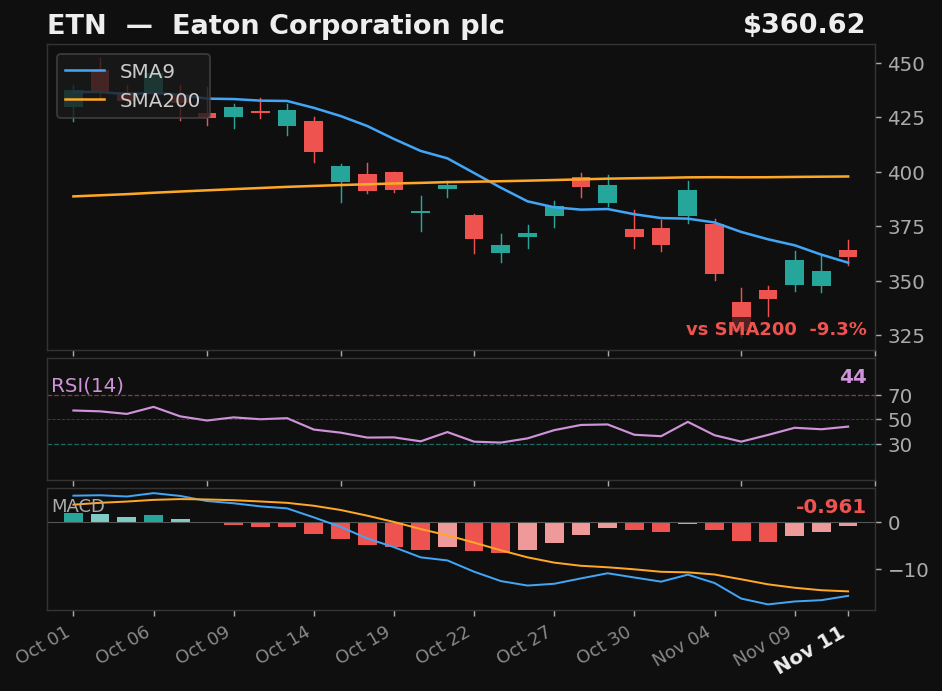
ETN
Eaton Corporation plc
NYSE
- 16.5% pullback — 5 days below SMA9
- Prior rally: 20%
- MACD histogram rising from negative — early momentum signal
ExplosiveUp
Exp Score67Days Below5Pullback%16.5
Returns
StockMktDiff
1D-0.4%-0.4%-0.1%
2D-2.1%-0.7%-1.4%
3D-6.6%-2.6%-4.0%
5D-6.2%-3.9%-2.3%
10D———
 click to enlarge
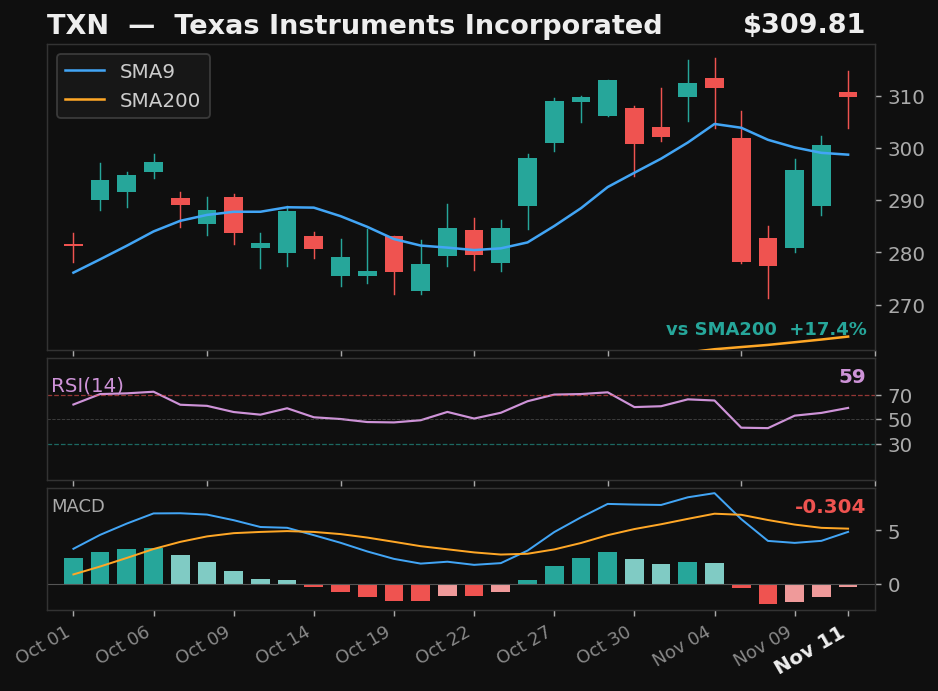
TXN
Texas Instruments Incorporated
NASDAQ
- 11.0% pullback — 3 days below SMA9
- Prior rally: 12%
- Above SMA200 (17%)
- MACD histogram rising from negative — early momentum signal
ExplosiveUp
Exp Score63Days Below3Pullback%11.0
Returns
StockMktDiff
1D+0.9%-0.4%+1.2%
2D-2.0%-0.7%-1.3%
3D-5.0%-2.6%-2.4%
5D-5.6%-3.9%-1.7%
10D———
 click to enlarge
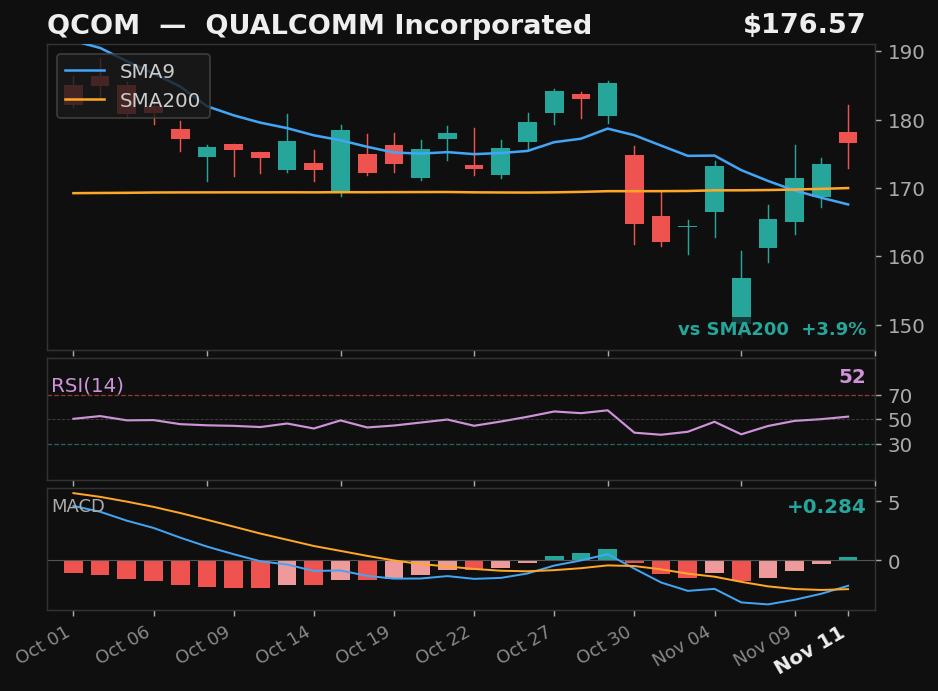
QCOM
QUALCOMM Incorporated
NASDAQ
- 15.5% pullback — 6 days below SMA9
- Prior rally: 18%
- Above SMA200 (4%)
- MACD momentum building
ExplosiveUp
Exp Score63Days Below6Pullback%15.5
Returns
StockMktDiff
1D+0.3%-0.4%+0.7%
2D-2.3%-0.7%-1.6%
3D-4.6%-2.6%-1.9%
5D-9.5%-3.9%-5.6%
10D———
 click to enlarge
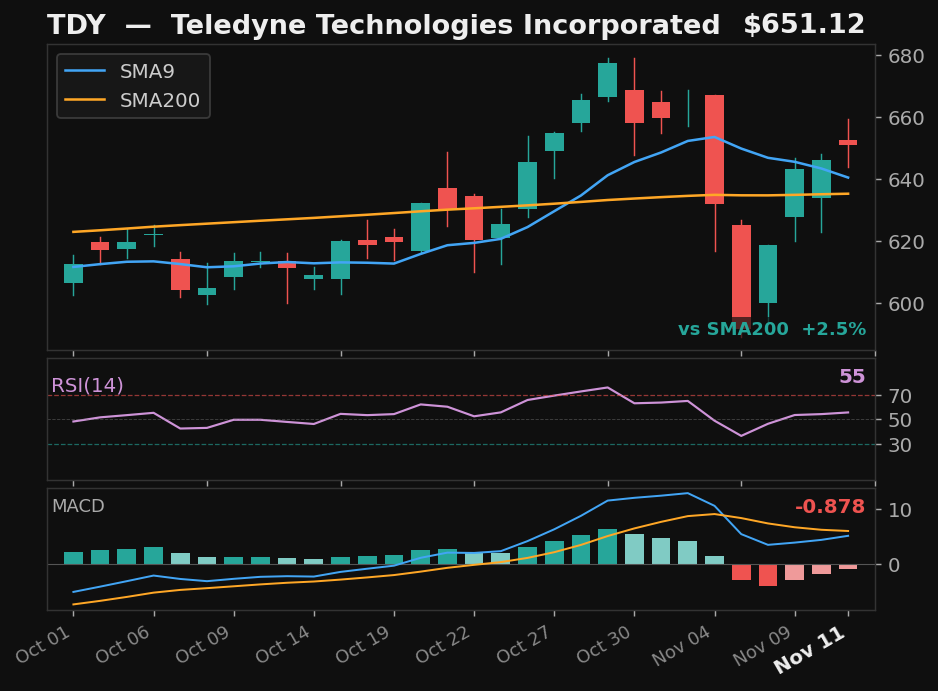
TDY
Teledyne Technologies Incorporated
NYSE
- 10.8% pullback — 4 days below SMA9
- Prior rally: 12%
- Above SMA200 (2%)
- MACD histogram rising from negative — early momentum signal
ExplosiveUp
Exp Score60Days Below4Pullback%10.8
Returns
StockMktDiff
1D-0.5%-0.4%-0.2%
2D-1.1%-0.7%-0.4%
3D-3.6%-2.6%-0.9%
5D-3.6%-3.9%+0.3%
10D———
 click to enlarge
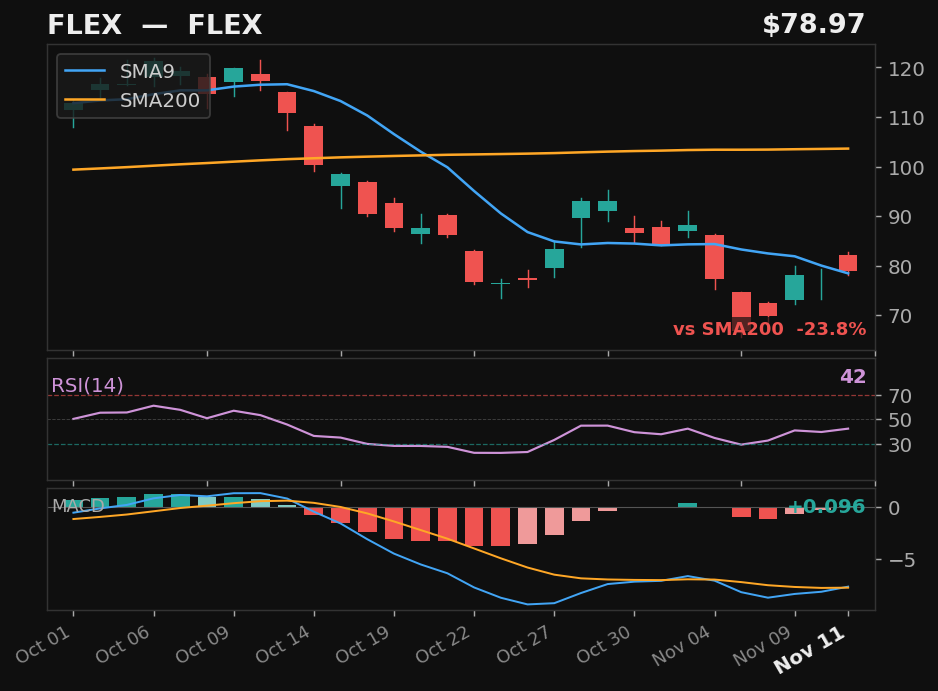
FLEX
FLEX
NASDAQ
- 24.3% pullback — 5 days below SMA9
- Prior rally: 32% — strong trend to recover into
- MACD momentum building
ExplosiveUp
Exp Score59Days Below5Pullback%24.3
Returns
StockMktDiff
1D-1.1%-0.4%-0.7%
2D-5.1%-0.7%-4.3%
3D-5.3%-2.6%-2.7%
5D-5.2%-3.9%-1.3%
10D———
 click to enlarge
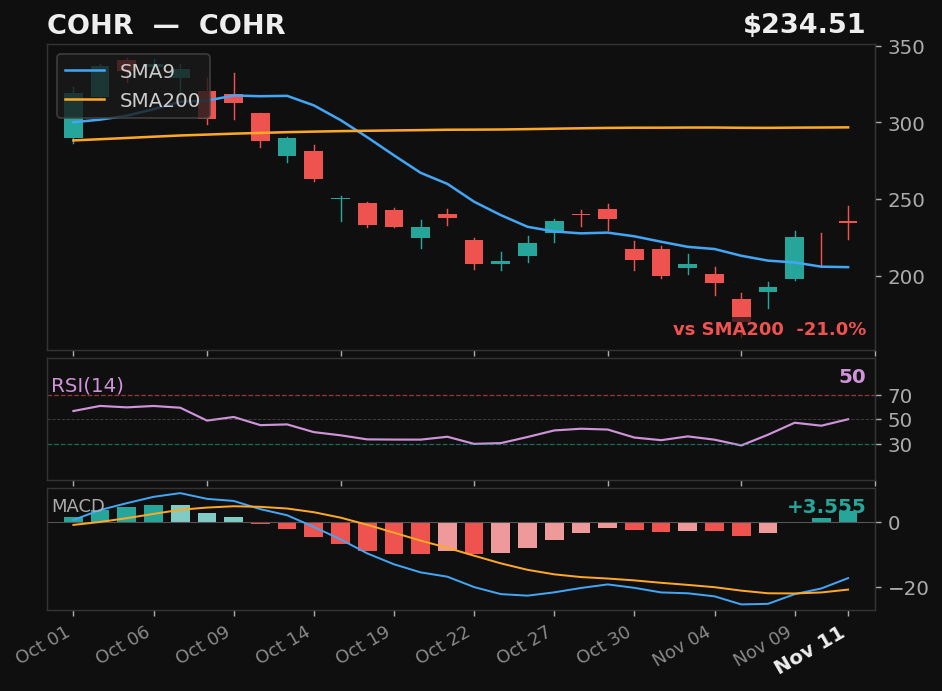
COHR
COHR
NYSE
- 28.4% pullback — 6 days below SMA9
- Prior rally: 40% — strong trend to recover into
- MACD momentum building
ExplosiveUp
Exp Score59Days Below6Pullback%28.4
Returns
StockMktDiff
1D-1.0%-0.4%-0.7%
2D-7.0%-0.7%-6.3%
3D-13.3%-2.6%-10.6%
5D-9.2%-3.9%-5.3%
10D———
 click to enlarge
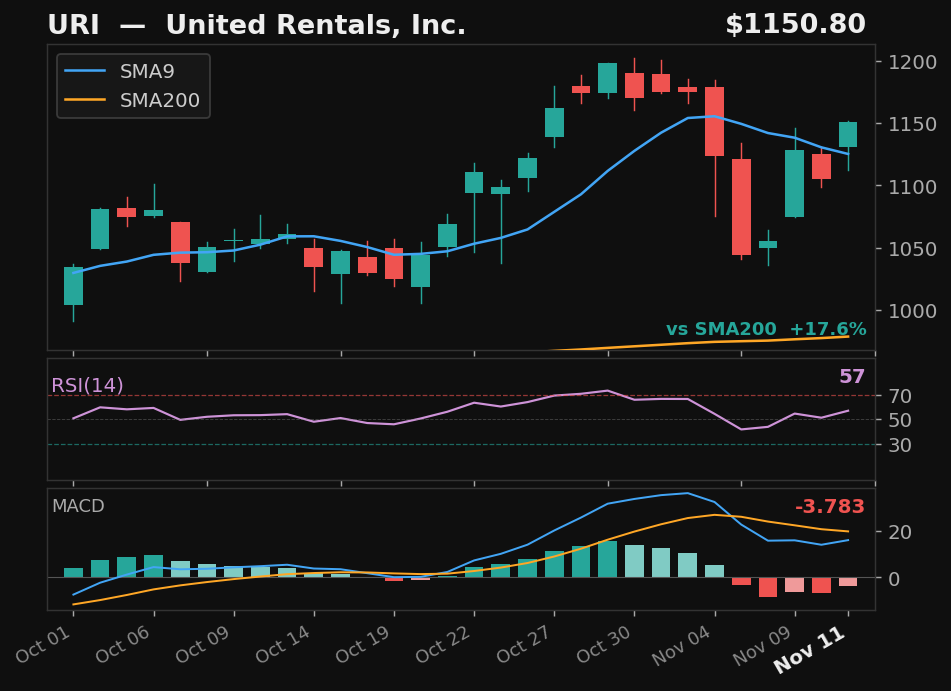
URI
United Rentals, Inc.
NYSE
- 11.2% pullback — 5 days below SMA9
- Prior rally: 13%
- Above SMA200 (18%)
- MACD histogram rising from negative — early momentum signal
ExplosiveUp
Exp Score55Days Below5Pullback%11.2
Returns
StockMktDiff
1D-1.0%-0.4%-0.7%
2D-2.3%-0.7%-1.6%
3D-4.9%-2.6%-2.3%
5D-5.4%-3.9%-1.5%
10D———
 click to enlarge
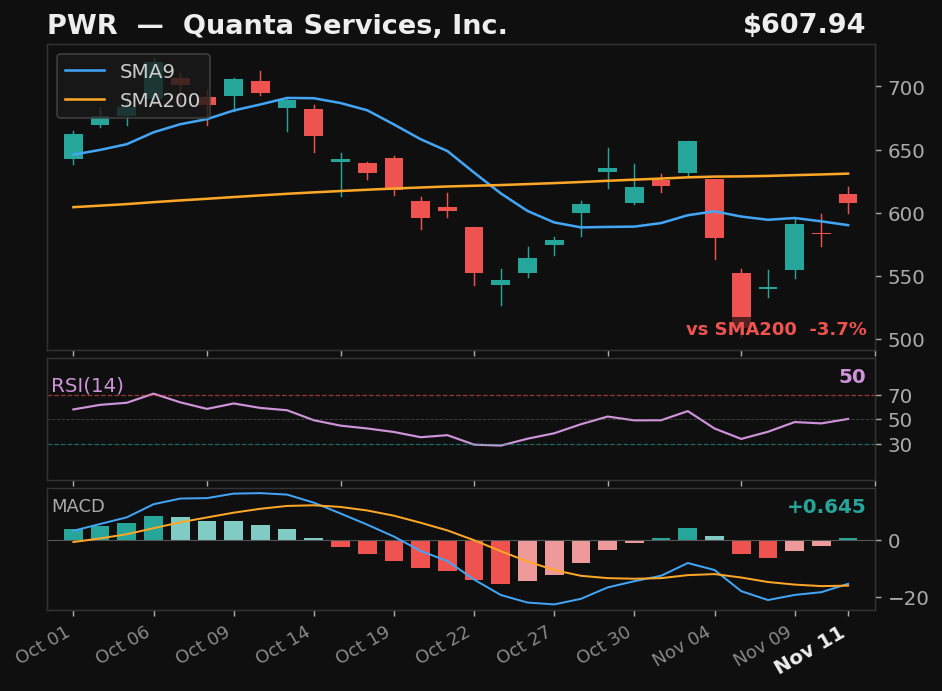
PWR
Quanta Services, Inc.
NYSE
- 22.5% pullback — 5 days below SMA9
- Prior rally: 29% — strong trend to recover into
- MACD momentum building
ExplosiveUp
Exp Score54Days Below5Pullback%22.5
Returns
StockMktDiff
1D-0.3%-0.4%+0.1%
2D-1.0%-0.7%-0.3%
3D-3.6%-2.6%-1.0%
5D-0.9%-3.9%+3.0%
10D———
 click to enlarge
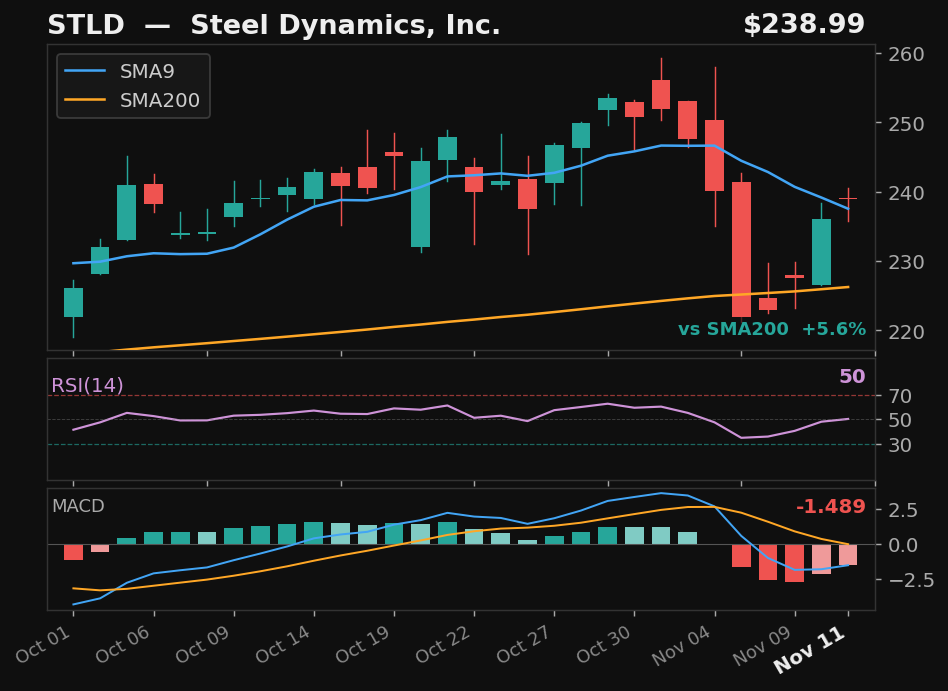
STLD
Steel Dynamics, Inc.
NASDAQ
- 10.4% pullback — 5 days below SMA9
- Prior rally: 12%
- Above SMA200 (6%)
- MACD histogram rising from negative — early momentum signal
ExplosiveUp
Exp Score52Days Below5Pullback%10.4
Returns
StockMktDiff
1D-0.8%-0.4%-0.4%
2D-4.0%-0.7%-3.3%
3D-5.6%-2.6%-3.0%
5D-6.8%-3.9%-2.9%
10D———
 click to enlarge
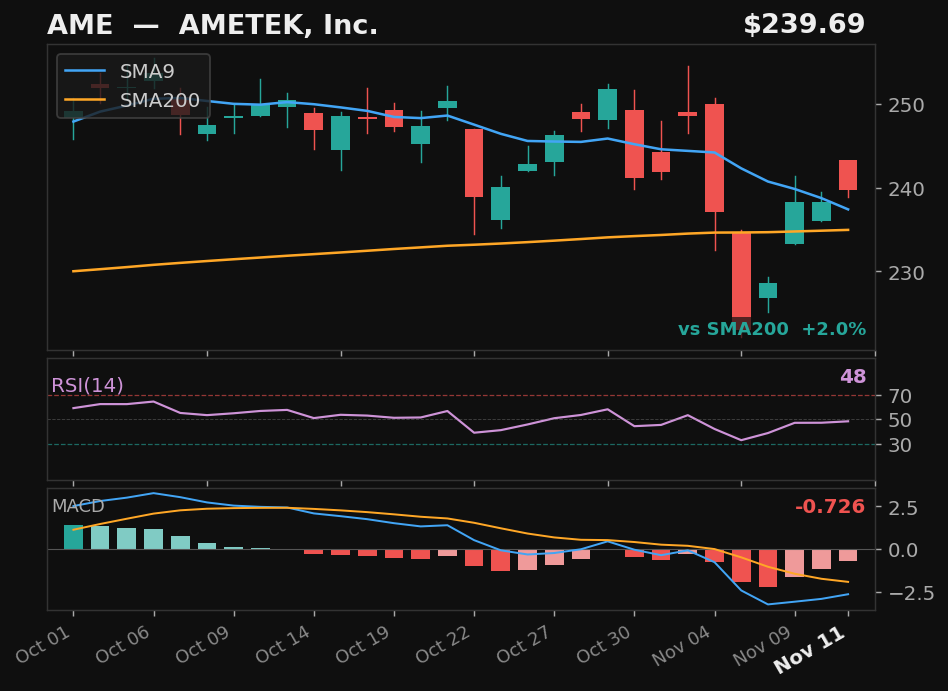
AME
AMETEK, Inc.
NYSE
- 10.3% pullback — 5 days below SMA9
- Prior rally: 11%
- Above SMA200 (2%)
- MACD histogram rising from negative — early momentum signal
ExplosiveUp
Exp Score49Days Below5Pullback%10.3
Returns
StockMktDiff
1D+0.6%-0.4%+0.9%
2D+1.0%-0.7%+1.7%
3D-1.6%-2.6%+1.0%
5D-1.7%-3.9%+2.2%
10D———
 click to enlarge
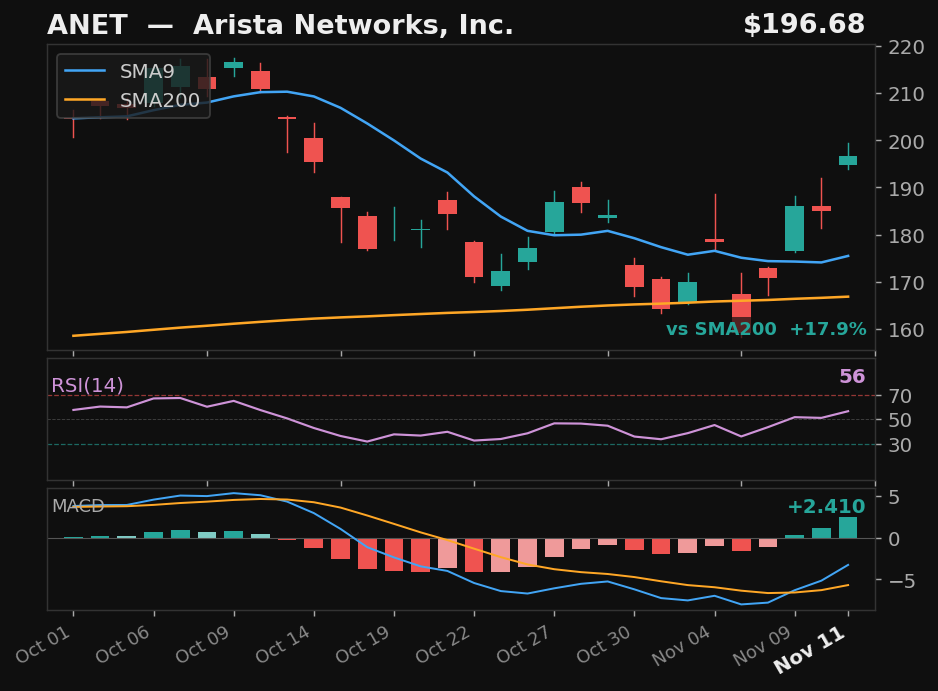
ANET
Arista Networks, Inc.
NYSE
- 10.8% pullback — 2 days below SMA9
- Prior rally: 12%
- Above SMA200 (18%)
- MACD momentum building
ExplosiveUp
Exp Score44Days Below2Pullback%10.8
Returns
StockMktDiff
1D+5.1%-0.4%+5.4%
2D+0.3%-0.7%+1.0%
3D-4.9%-2.6%-2.3%
5D-1.4%-3.9%+2.5%
10D———
 click to enlarge
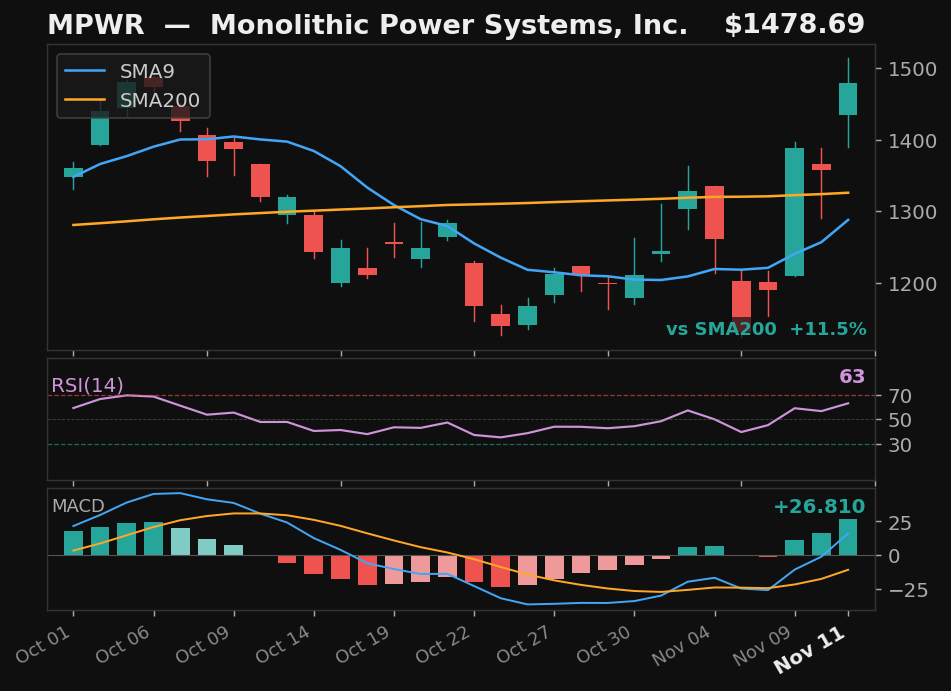
MPWR
Monolithic Power Systems, Inc.
NASDAQ
- 10.3% pullback — 2 days below SMA9
- Prior rally: 11%
- Above SMA200 (12%)
- MACD momentum building
ExplosiveUp
Exp Score44Days Below2Pullback%10.3
Returns
StockMktDiff
1D-2.1%-0.4%-1.8%
2D-6.0%-0.7%-5.2%
3D-11.1%-2.6%-8.5%
5D-11.3%-3.9%-7.4%
10D———
Empirical4
 click to enlarge
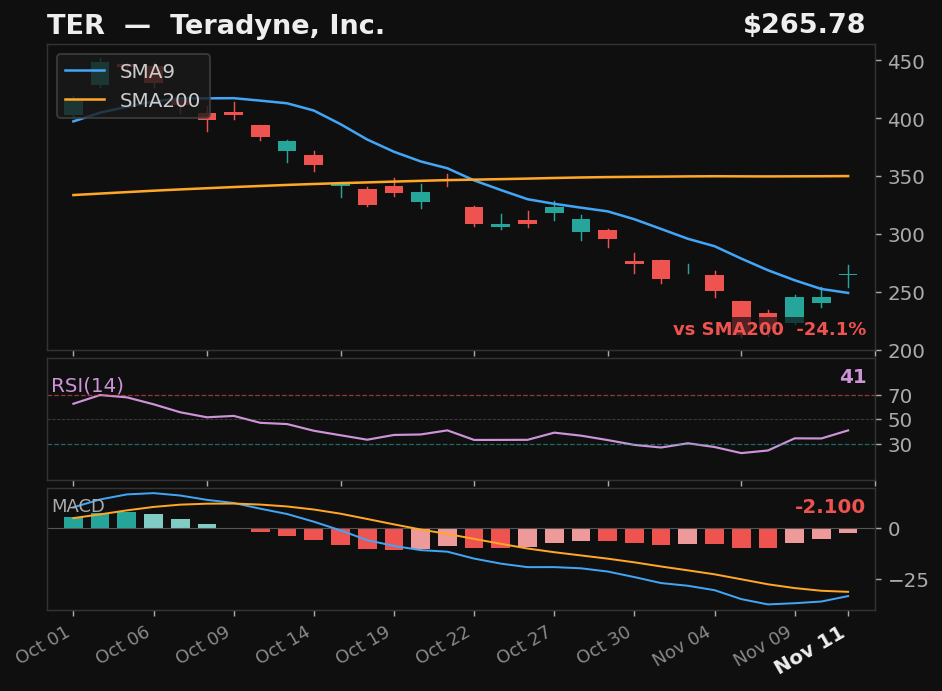
TER
Teradyne, Inc.
NASDAQ
- 50.6% pullback over 25 days — full candle above SMA9
- RSI rising from 41
- MACD histogram rising while still negative — early recovery signal
- 24.1% below SMA200 — extended from trend
Empirical
Emp Score111.3Body Above✓
Returns
StockMktDiff
1D-0.8%-0.4%-0.4%
2D-6.1%-0.7%-5.4%
3D-12.7%-2.6%-10.1%
5D-11.5%-3.9%-7.6%
10D———
 click to enlarge
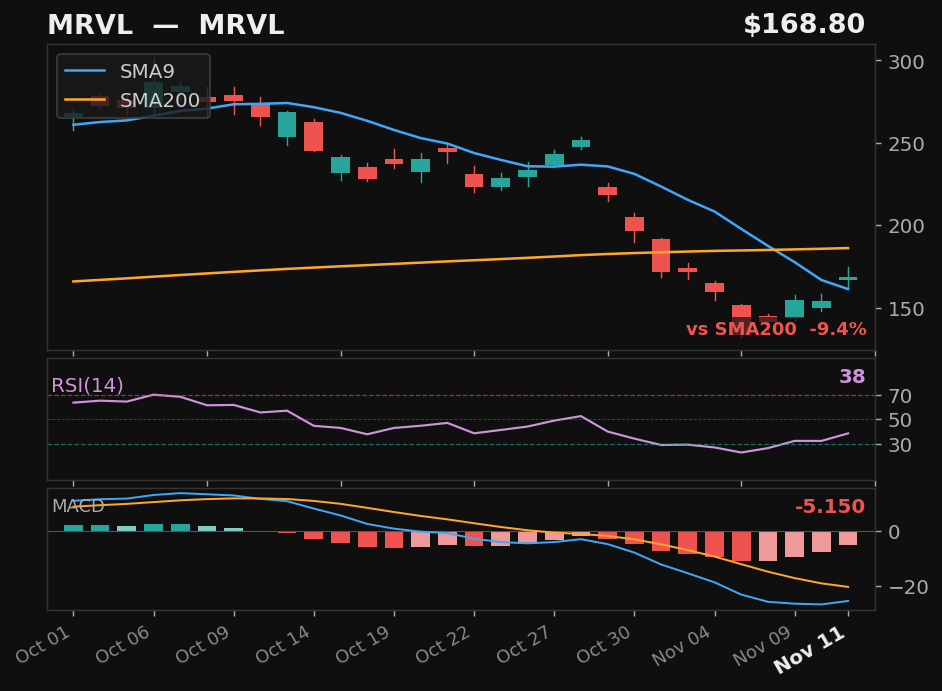
MRVL
MRVL
NASDAQ
- 46.9% pullback over 9 days — full candle above SMA9
- RSI rising from 38
- MACD histogram rising while still negative — early recovery signal
- 9.4% below SMA200 — extended from trend
Empirical
Emp Score99.7Body Above✓
Returns
StockMktDiff
1D-2.6%-0.4%-2.2%
2D-7.1%-0.7%-6.4%
3D-13.9%-2.6%-11.3%
5D-13.8%-3.9%-9.9%
10D———
 click to enlarge
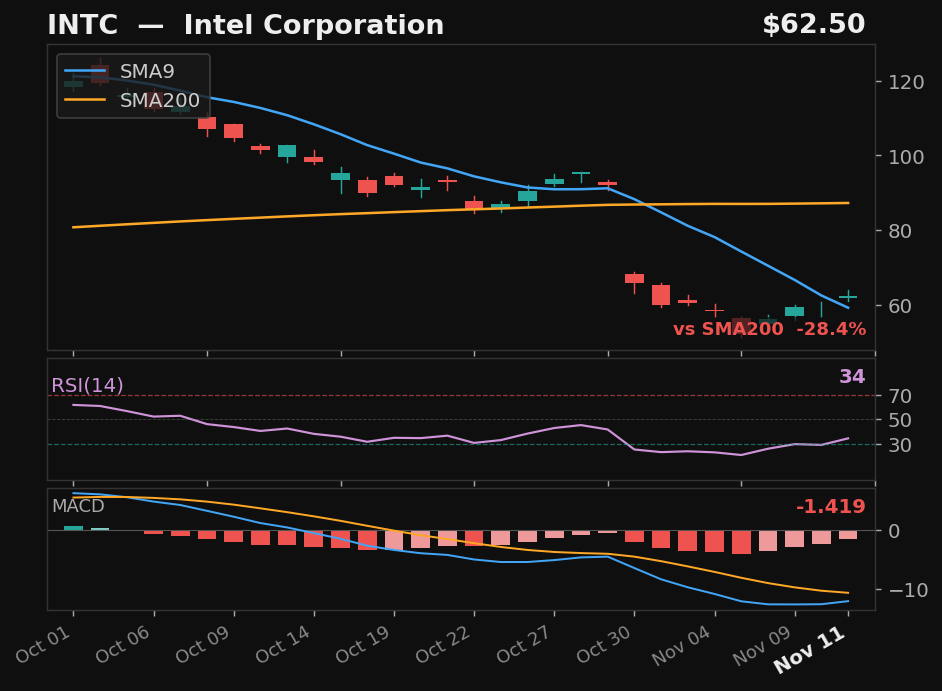
INTC
Intel Corporation
NASDAQ
- 43.2% pullback over 8 days — full candle above SMA9
- RSI rising from 35
- MACD histogram rising while still negative — early recovery signal
- 28.4% below SMA200 — extended from trend
Empirical
Emp Score98.0Body Above✓
Returns
StockMktDiff
1D-2.1%-0.4%-1.7%
2D-4.5%-0.7%-3.8%
3D-11.2%-2.6%-8.6%
5D-12.5%-3.9%-8.6%
10D———
 click to enlarge
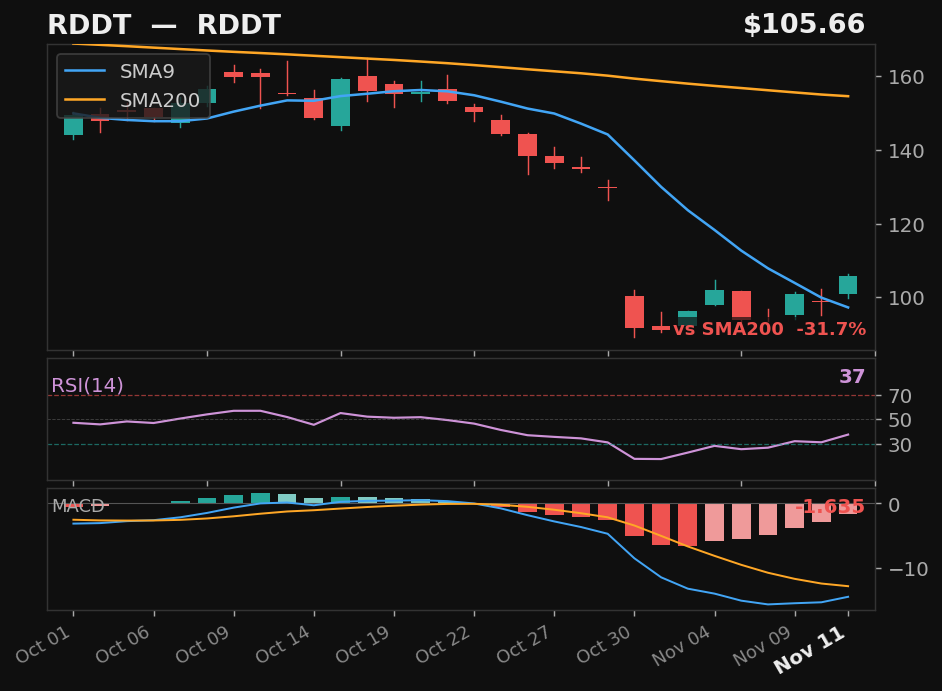
RDDT
RDDT
NYSE
- 41.7% pullback over 17 days — full candle above SMA9
- RSI rising from 38
- MACD histogram rising while still negative — early recovery signal
- 31.7% below SMA200 — extended from trend
Empirical
Emp Score96.0Body Above✓
Returns
StockMktDiff
1D-5.8%-0.4%-5.4%
2D-6.8%-0.7%-6.1%
3D-12.1%-2.6%-9.5%
5D-11.0%-3.9%-7.1%
10D———