Monday, July 13, 2026  ·  After Close
SPY-0.8% QQQ-1.9% DIA-0.2% IWM-0.8% VIX+14.2%
Empirical4
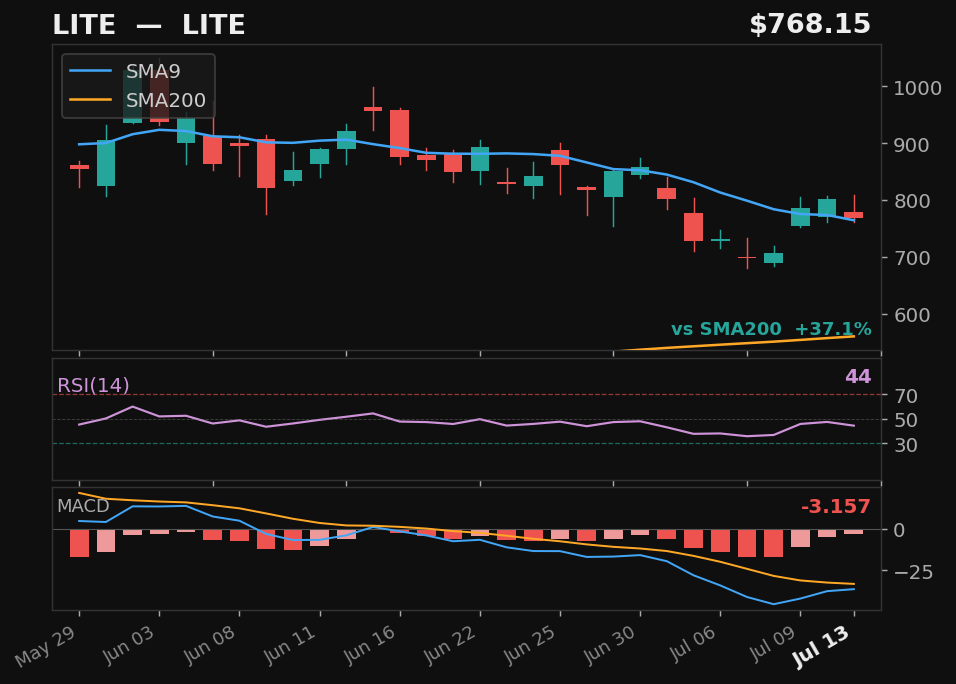
LITE chartclick to enlarge
LITE LITE OTHER
  • 27.0% pullback — full candle body above SMA9
  • MACD histogram rising while still negative — early recovery signal
  • 37.1% above SMA200 — extended from trend
Empirical
Emp Score68.1Body Above
Returns
StockMktDiff
1D
2D
3D
5D
10D
results pending next close
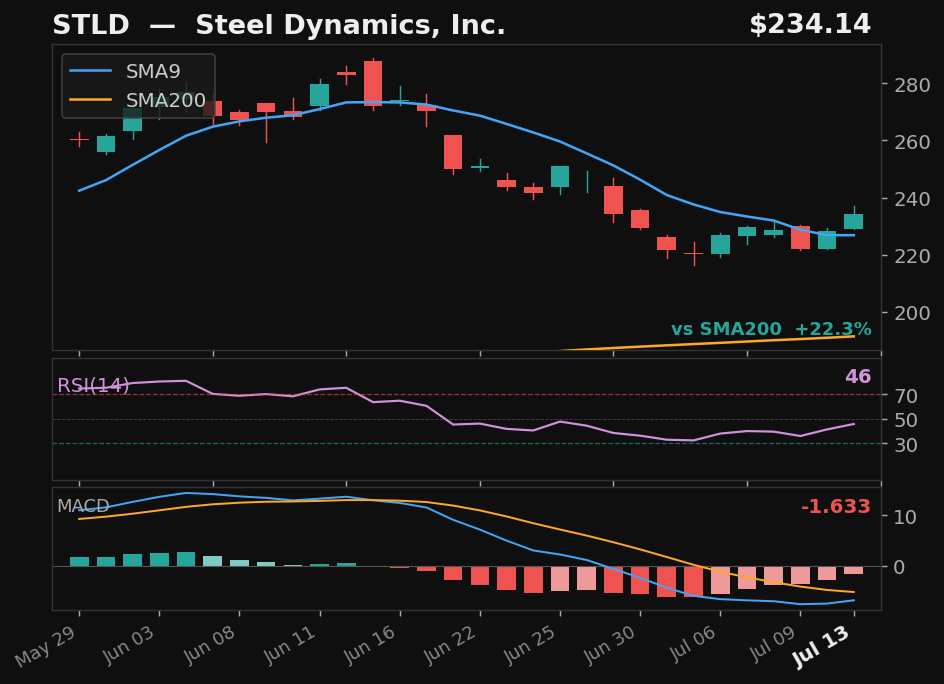
STLD chartclick to enlarge
STLD Steel Dynamics, Inc. NASDAQ
  • 19.7% pullback — full candle body above SMA9
  • RSI rising from 46
  • MACD histogram rising while still negative — early recovery signal
  • 22.3% above SMA200 — extended from trend
Empirical
Emp Score49.0Body Above
Returns
StockMktDiff
1D
2D
3D
5D
10D
results pending next close
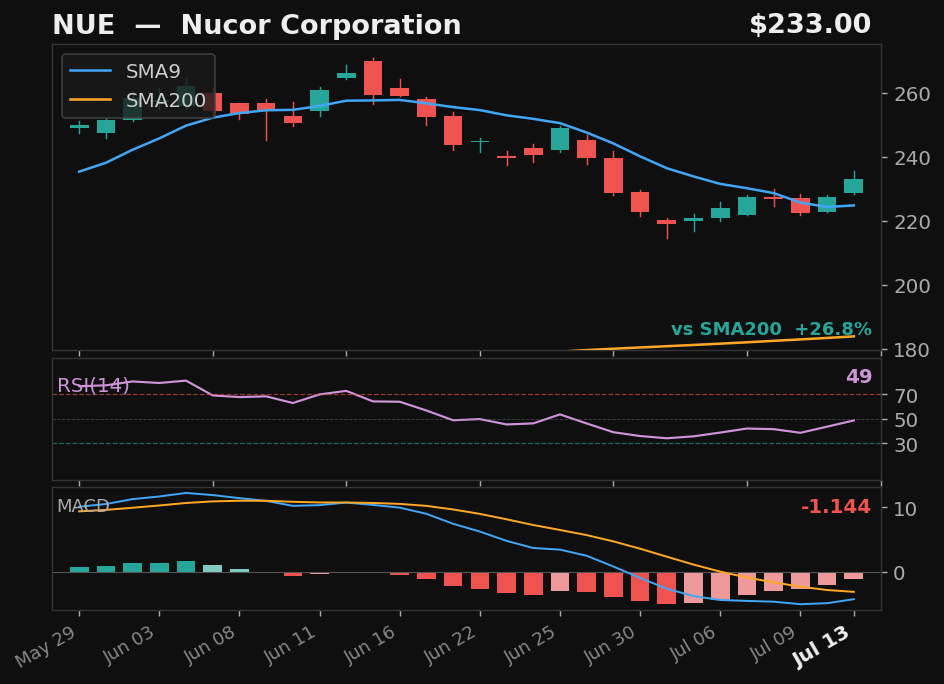
NUE chartclick to enlarge
NUE Nucor Corporation NYSE
  • 15.5% pullback — full candle body above SMA9
  • RSI rising from 48
  • MACD histogram rising while still negative — early recovery signal
  • 26.8% above SMA200 — extended from trend
Empirical
Emp Score42.0Body Above
Returns
StockMktDiff
1D
2D
3D
5D
10D
results pending next close
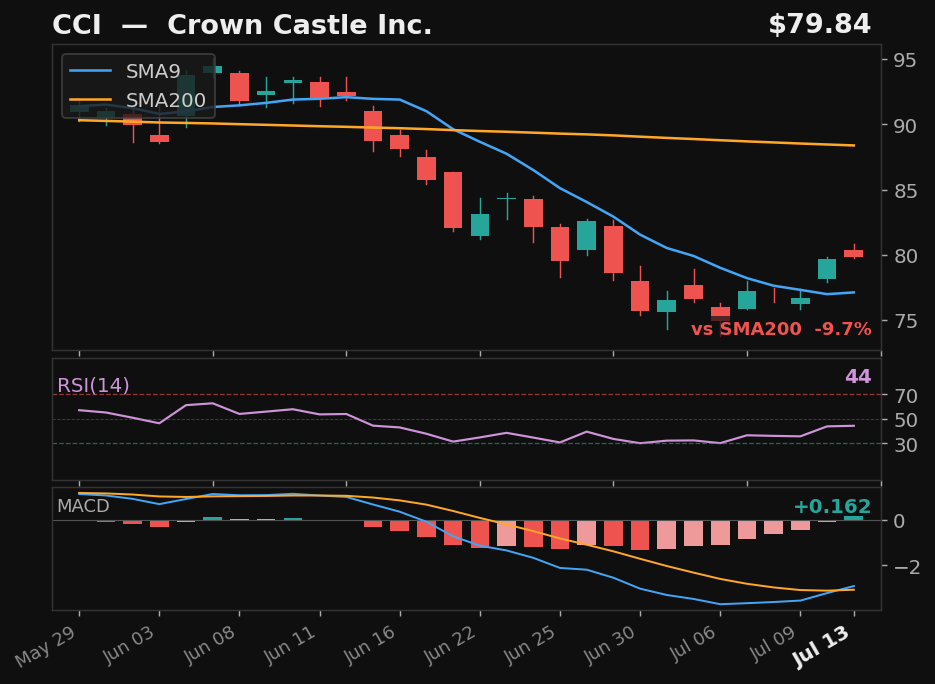
CCI chartclick to enlarge
CCI Crown Castle Inc. NYSE
  • 18.7% pullback — full candle body above SMA9
  • RSI rising from 45
  • 9.7% below SMA200 — extended from trend
Empirical
Emp Score40.3Body Above
Returns
StockMktDiff
1D
2D
3D
5D
10D
results pending next close
Important Disclaimer

This application is provided for informational, educational, and research purposes only, including live market research and personal analysis. It does not constitute financial, investment, legal, or tax advice.

Nothing contained within this platform should be construed as a recommendation, solicitation, or endorsement to buy, sell, or hold any security or financial instrument.

The operator of this site is not a registered investment advisor, broker-dealer, or financial professional. reddogwatch.com is not affiliated with any brokerage, exchange, or regulated financial institution.

All screening results are generated automatically by proprietary algorithms without human review or individualized analysis. Results are not tailored to any individual’s financial situation, investment goals, or risk tolerance. Any paid subscription tier, if offered, provides access to the same systematic, non-personalized screening outputs and does not create an advisory relationship of any kind.

Market data is sourced from third-party providers and may be delayed, incomplete, or inaccurate. All strategies and screening results are experimental in nature and may contain errors or omissions. No guarantee is made regarding the accuracy, completeness, timeliness, or reliability of any information presented.

You assume full responsibility for any trading or investment decisions made based on information from this platform. Use of this application is entirely at your own risk.

Trading and investing involve substantial risk, including the possible loss of all invested capital. Past performance is not indicative of future results.

This platform is operated in the United States and is governed by the laws of the Commonwealth of Kentucky, without regard to conflict of law principles. This platform is intended for use by residents of the United States only. Users outside the United States access this platform at their own risk and are solely responsible for compliance with their local laws and regulations.

By clicking “I Understand,” you acknowledge that you have read this disclaimer in full and agree to these terms.