Wednesday, June 24, 2026 · After Close
Explosive Up Setups1
 click to enlarge
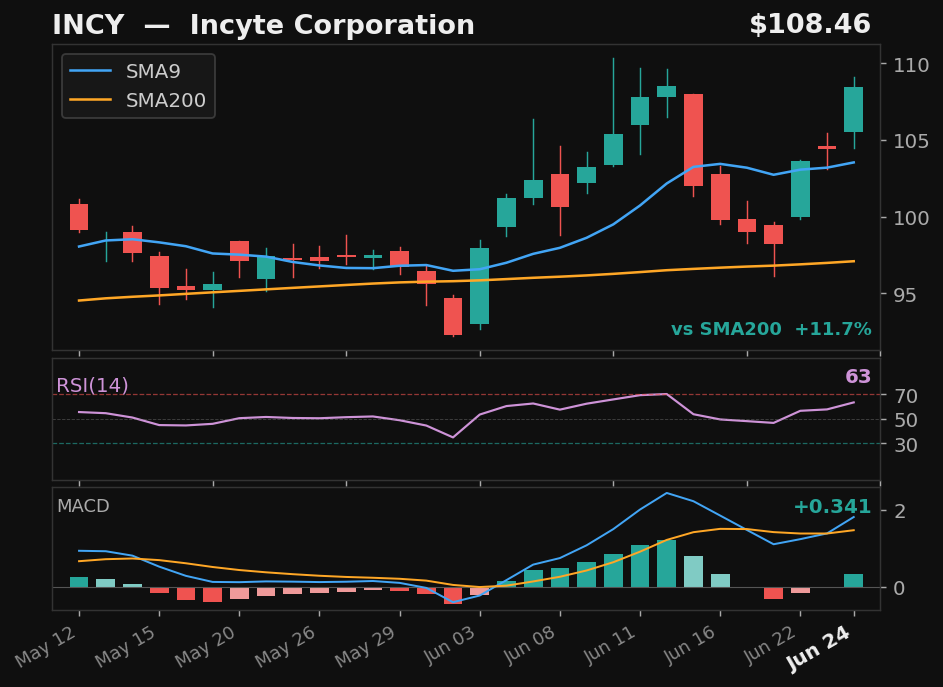
INCY
Incyte Corporation
NASDAQ
- 9.5% pullback — 4 days below SMA9
- Prior rally: 10%
- Above SMA200 (12%)
- MACD momentum building
ExplosiveUp
Exp Score58Days Below4Pullback%9.5
Returns
StockMktDiff
1D———
2D———
3D———
5D———
10D———
results pending next close
Empirical4
 click to enlarge
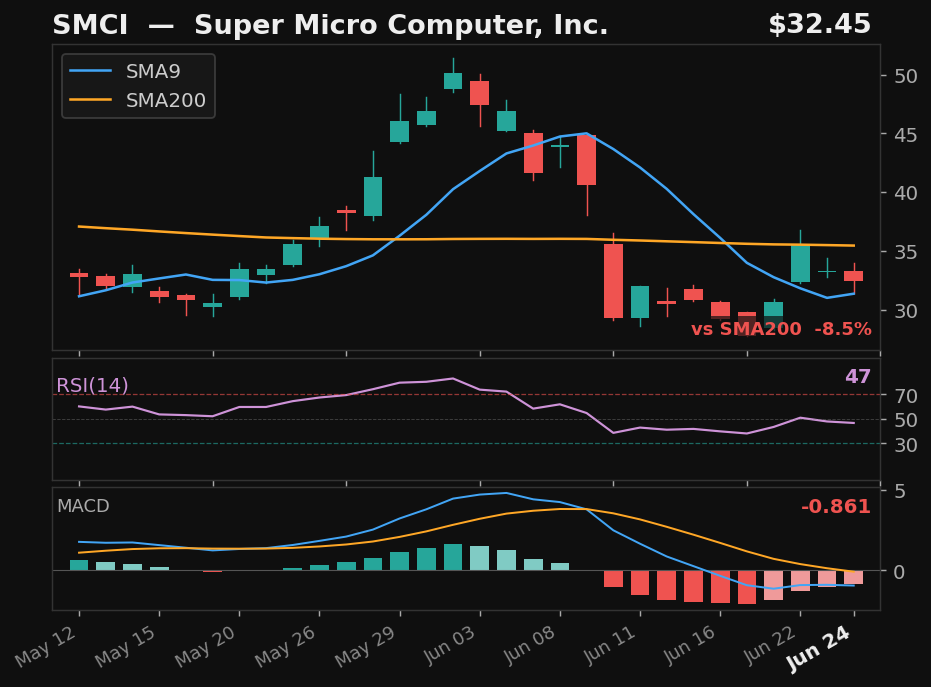
SMCI
Super Micro Computer, Inc.
NASDAQ
- 40.8% pullback — full candle body above SMA9
- MACD histogram rising while still negative — early recovery signal
- 8.5% below SMA200 — extended from trend
Empirical
Emp Score87.1Body Above✓
Returns
StockMktDiff
1D———
2D———
3D———
5D———
10D———
results pending next close
 click to enlarge
CIEN
Ciena Corporation
NYSE
- 31.0% pullback — full candle body above SMA9
- RSI rising from 44
- MACD histogram rising while still negative — early recovery signal
- 47.0% above SMA200 — extended from trend
Empirical
Emp Score79.0Body Above✓
Returns
StockMktDiff
1D———
2D———
3D———
5D———
10D———
results pending next close
 click to enlarge
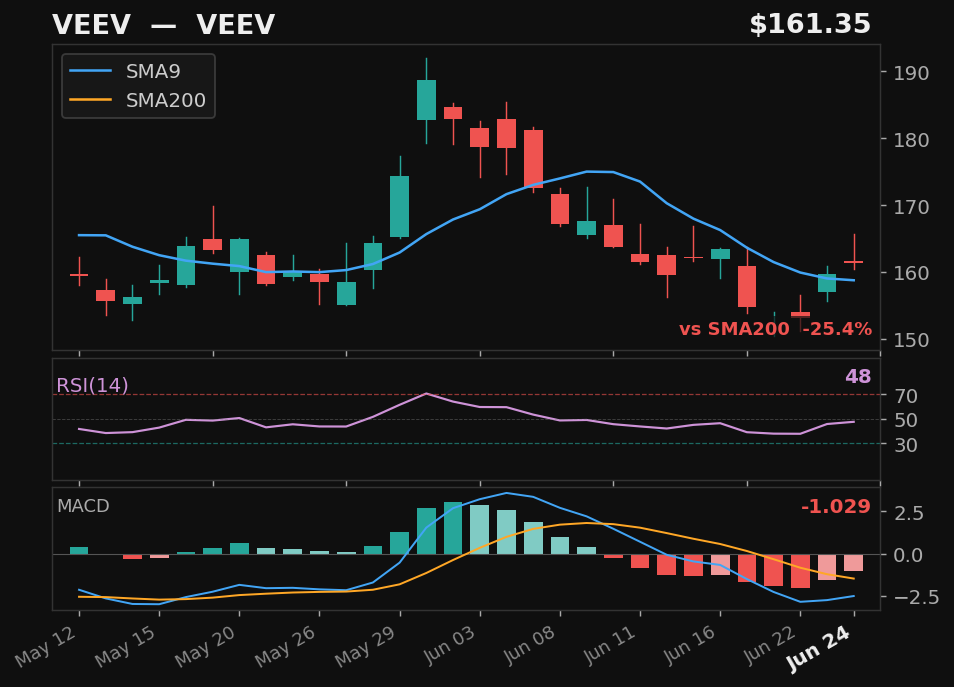
VEEV
VEEV
NYSE
- 14.2% pullback — full candle body above SMA9
- RSI rising from 49
- MACD histogram rising while still negative — early recovery signal
- 25.4% below SMA200 — extended from trend
Empirical
Emp Score39.1Body Above✓
Returns
StockMktDiff
1D———
2D———
3D———
5D———
10D———
results pending next close
 click to enlarge
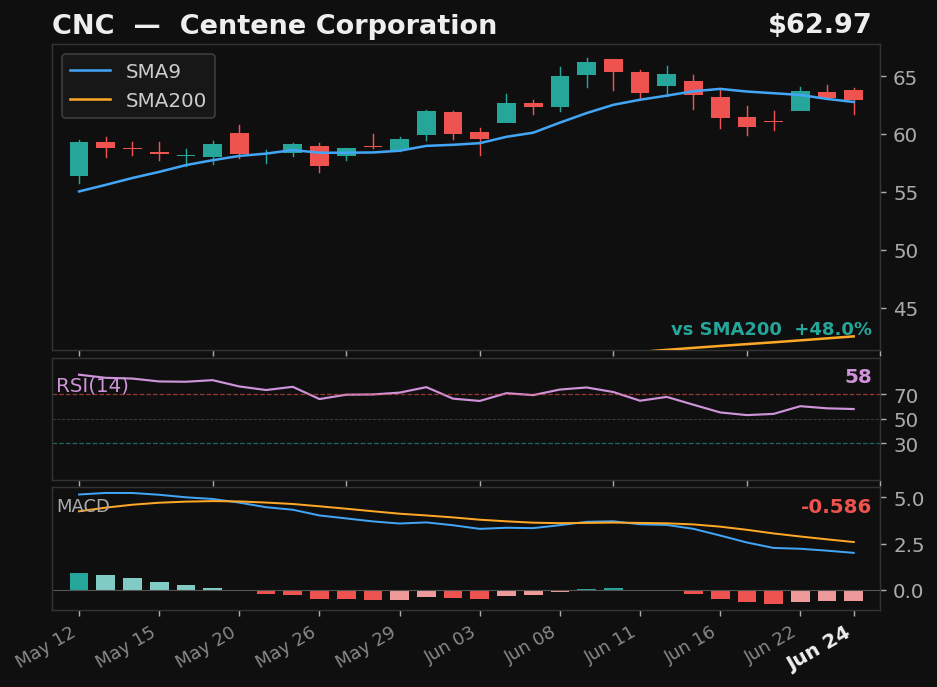
CNC
Centene Corporation
NYSE
- 7.0% pullback — full candle body above SMA9
- MACD histogram rising while still negative — early recovery signal
- 48.0% above SMA200 — extended from trend
Empirical
Emp Score36.4Body Above✓
Returns
StockMktDiff
1D———
2D———
3D———
5D———
10D———
results pending next close