Friday, June 12, 2026 · After Close
★ Highlights3
 click to enlarge
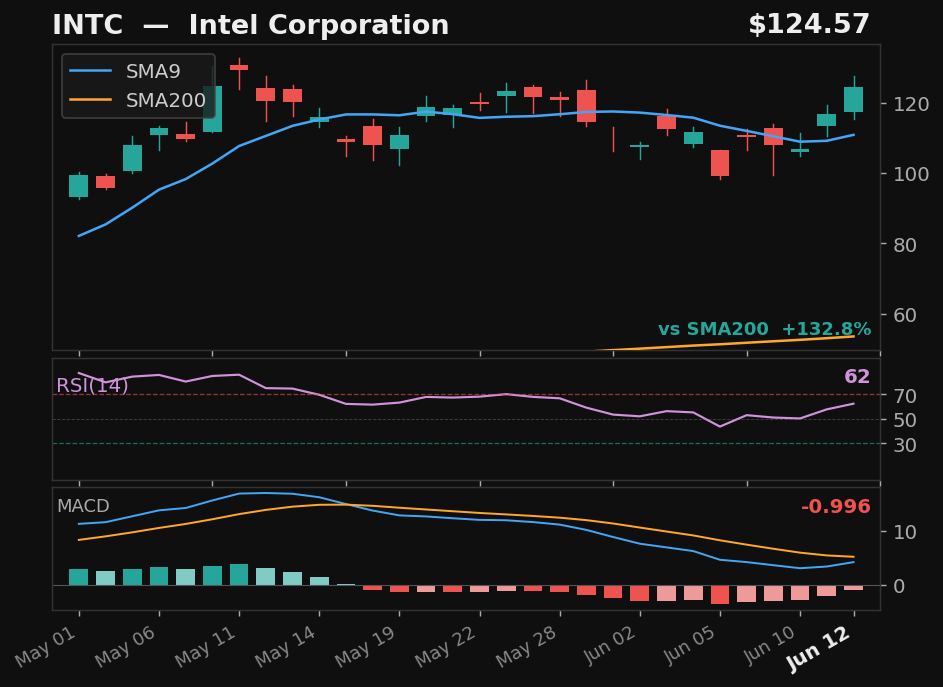
INTC★
Intel Corporation
NASDAQ
- 18.0% pullback — full candle body above SMA9
- RSI at 62 — confirmed recovery momentum
- MACD histogram rising while still negative — early recovery signal
- 132.8% above SMA200 — extended from trend
EmpiricalSwingTrader
Returns
StockMktDiff
1D———
2D———
3D———
5D———
10D———
results pending next close
 click to enlarge
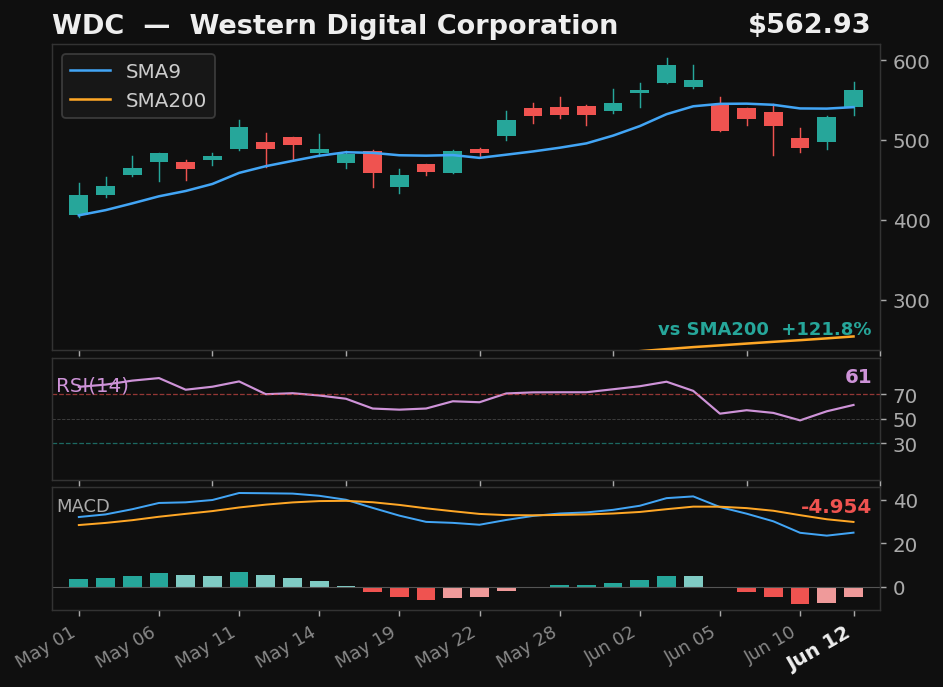
WDC★
Western Digital Corporation
NASDAQ
- 14.8% pullback over 5 days — full candle above SMA9
- RSI at 61 — confirmed recovery momentum
- MACD histogram rising while still negative — early recovery signal
- 121.8% above SMA200 — extended from trend
ExplosiveUpEmpirical
Returns
StockMktDiff
1D———
2D———
3D———
5D———
10D———
results pending next close
 click to enlarge
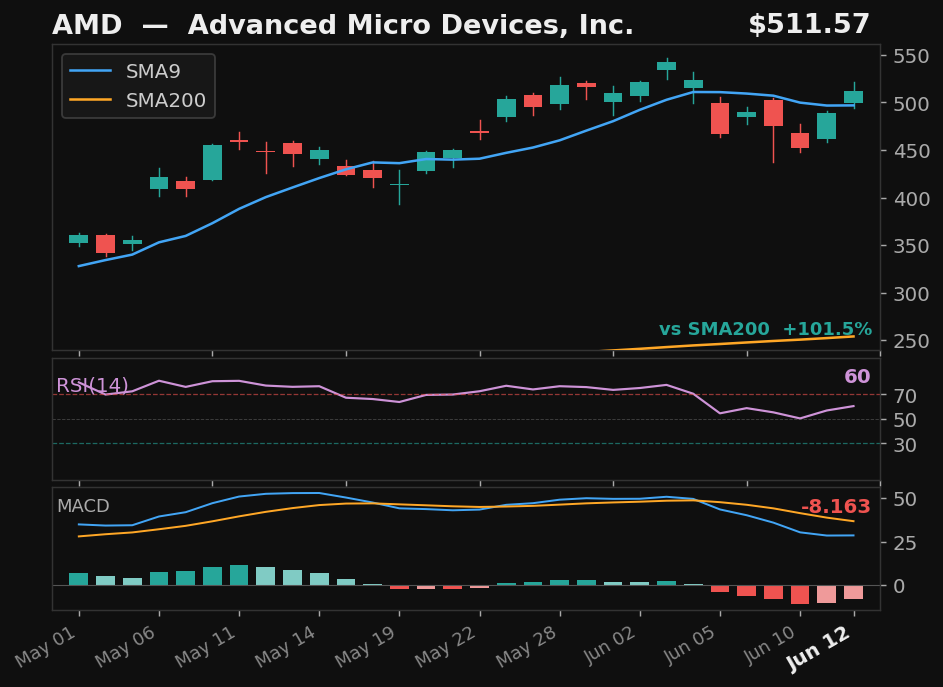
AMD★
Advanced Micro Devices, Inc.
NASDAQ
- 13.5% pullback over 5 days — full candle above SMA9
- RSI at 60 — confirmed recovery momentum
- MACD histogram rising while still negative — early recovery signal
- 101.5% above SMA200 — extended from trend
ExplosiveUpEmpirical
Returns
StockMktDiff
1D———
2D———
3D———
5D———
10D———
results pending next close
Explosive Up Setups7
click to enlarge
AMD★
Advanced Micro Devices, Inc.
NASDAQ
- 13.5% pullback — 5 days below SMA9
- Prior rally: 16%
- 101% above SMA200 — strong structural position
- MACD histogram rising from negative — early momentum signal
ExplosiveUp
Exp Score100Days Below5Pullback%13.5
Returns
StockMktDiff
1D———
2D———
3D———
5D———
10D———
results pending next close
click to enlarge
WDC★
Western Digital Corporation
NASDAQ
- 14.8% pullback — 5 days below SMA9
- Prior rally: 17%
- 122% above SMA200 — strong structural position
- MACD histogram rising from negative — early momentum signal
ExplosiveUp
Exp Score100Days Below5Pullback%14.8
Returns
StockMktDiff
1D———
2D———
3D———
5D———
10D———
results pending next close
 click to enlarge
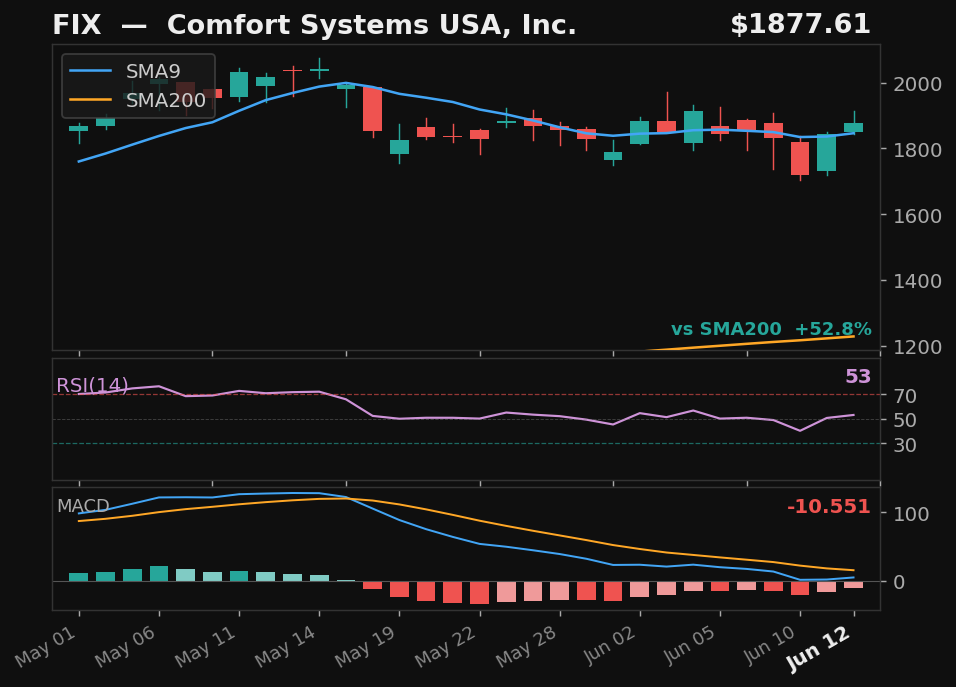
FIX
Comfort Systems USA, Inc.
NYSE
- 10.2% pullback — 4 days below SMA9
- Prior rally: 11%
- 53% above SMA200 — strong structural position
- MACD histogram rising from negative — early momentum signal
ExplosiveUp
Exp Score82Days Below4Pullback%10.2
Returns
StockMktDiff
1D———
2D———
3D———
5D———
10D———
results pending next close
 click to enlarge
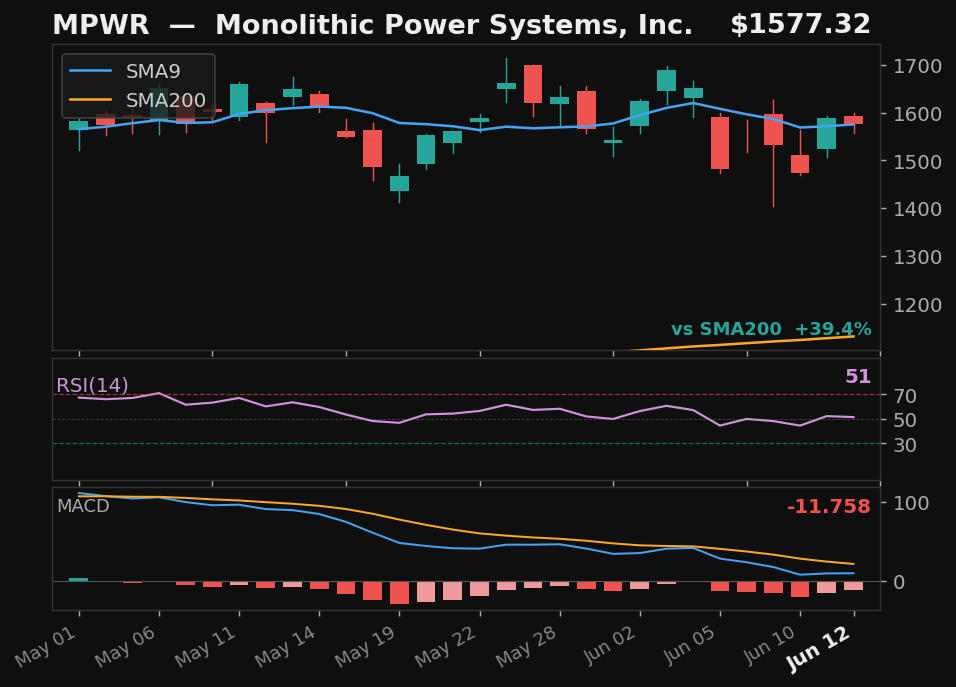
MPWR
Monolithic Power Systems, Inc.
NASDAQ
- 10.9% pullback — 4 days below SMA9
- Prior rally: 12%
- 39% above SMA200 — strong structural position
- MACD histogram rising from negative — early momentum signal
ExplosiveUp
Exp Score77Days Below4Pullback%10.9
Returns
StockMktDiff
1D———
2D———
3D———
5D———
10D———
results pending next close
 click to enlarge
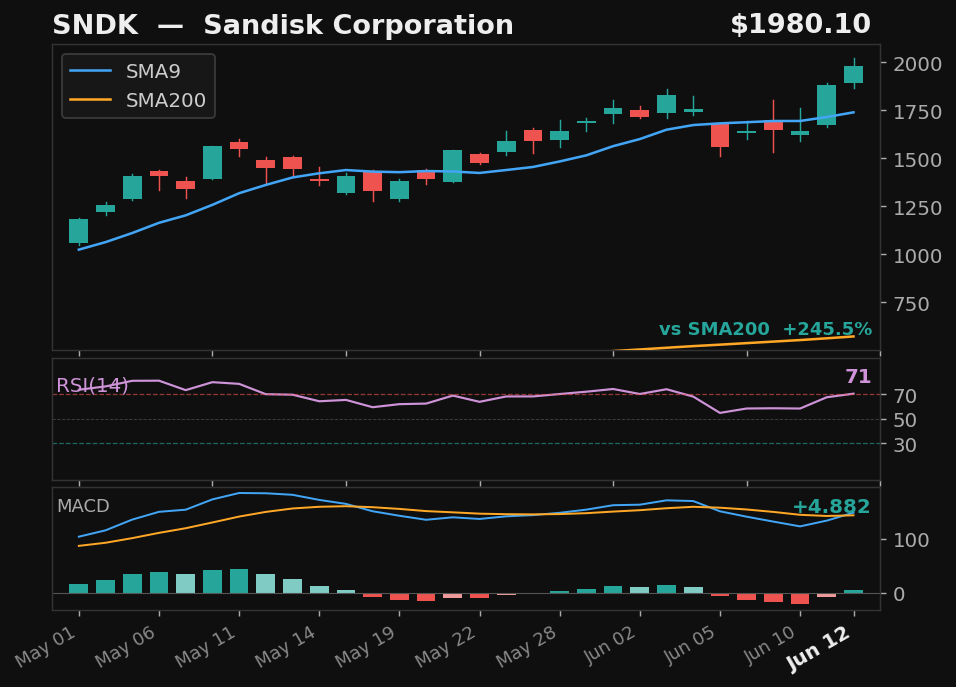
SNDK
Sandisk Corporation
NASDAQ
- 11.4% pullback — 4 days below SMA9
- Prior rally: 13%
- 246% above SMA200 — strong structural position
- MACD momentum building
ExplosiveUp
Exp Score65Days Below4Pullback%11.4
Returns
StockMktDiff
1D———
2D———
3D———
5D———
10D———
results pending next close
 click to enlarge
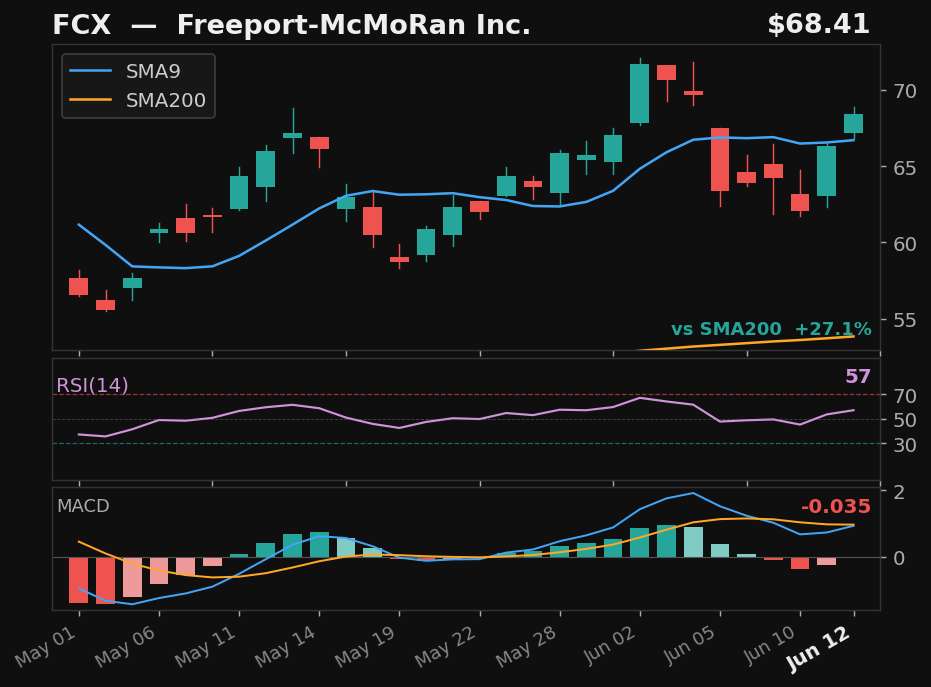
FCX
Freeport-McMoRan Inc.
NYSE
- 10.9% pullback — 5 days below SMA9
- Prior rally: 12%
- Above SMA200 (27%)
- MACD histogram rising from negative — early momentum signal
ExplosiveUp
Exp Score55Days Below5Pullback%10.9
Returns
StockMktDiff
1D———
2D———
3D———
5D———
10D———
results pending next close
 click to enlarge
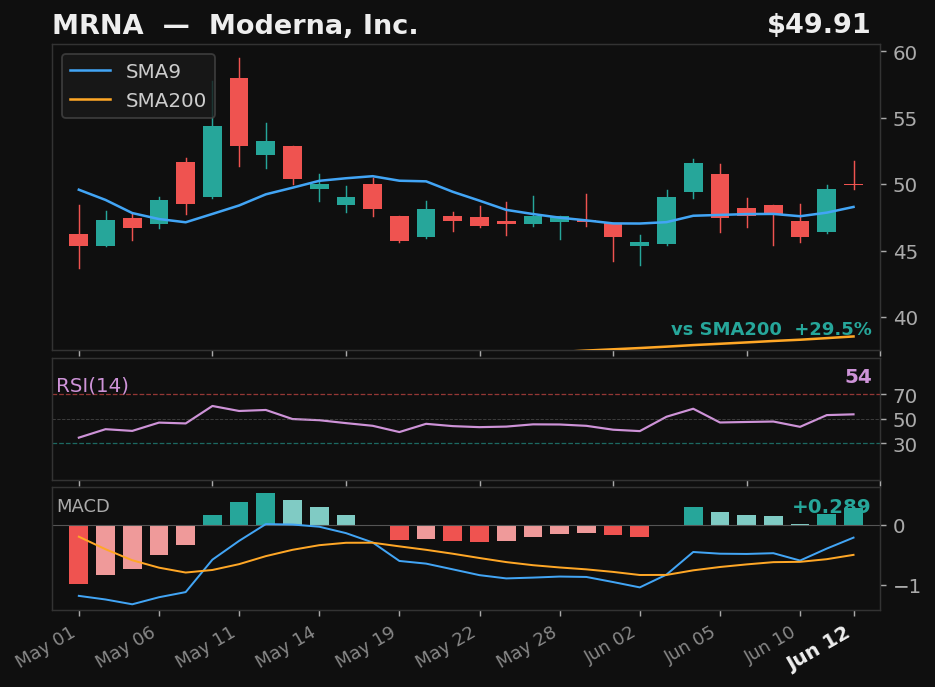
MRNA
Moderna, Inc.
NASDAQ
- 10.9% pullback — 4 days below SMA9
- Prior rally: 12%
- Above SMA200 (29%)
- MACD momentum building
ExplosiveUp
Exp Score55Days Below4Pullback%10.9
Returns
StockMktDiff
1D———
2D———
3D———
5D———
10D———
results pending next close
Empirical4
click to enlarge
INTC★
Intel Corporation
NASDAQ
- 18.0% pullback — full candle body above SMA9
- RSI at 62 — confirmed recovery momentum
- MACD histogram rising while still negative — early recovery signal
- 132.8% above SMA200 — extended from trend
Empirical
Emp Score83.8Body Above✓
Returns
StockMktDiff
1D———
2D———
3D———
5D———
10D———
results pending next close
click to enlarge
WDC★
Western Digital Corporation
NASDAQ
- 14.8% pullback over 5 days — full candle above SMA9
- RSI at 61 — confirmed recovery momentum
- MACD histogram rising while still negative — early recovery signal
- 121.8% above SMA200 — extended from trend
Empirical
Emp Score74.2Body Above✓
Returns
StockMktDiff
1D———
2D———
3D———
5D———
10D———
results pending next close
click to enlarge
AMD★
Advanced Micro Devices, Inc.
NASDAQ
- 13.5% pullback over 5 days — full candle above SMA9
- RSI at 60 — confirmed recovery momentum
- MACD histogram rising while still negative — early recovery signal
- 101.5% above SMA200 — extended from trend
Empirical
Emp Score65.5Body Above✓
Returns
StockMktDiff
1D———
2D———
3D———
5D———
10D———
results pending next close
 click to enlarge
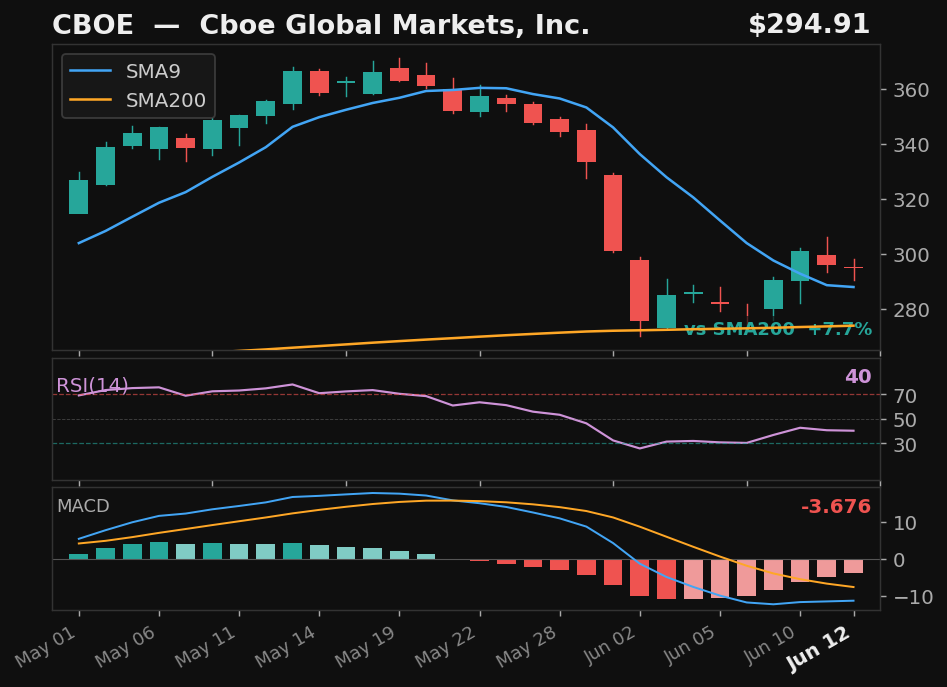
CBOE
Cboe Global Markets, Inc.
OTHER
- 23.6% pullback — full candle body above SMA9
- MACD histogram rising while still negative — early recovery signal
- 7.7% above SMA200 — extended from trend
Empirical
Emp Score52.6Body Above✓
Returns
StockMktDiff
1D———
2D———
3D———
5D———
10D———
results pending next close